Ahead of the recovery curve
We’ve become obsessed with watching the curve. Is it flattening? Is it spiking? We’re watching recovery rates with anticipation. For the day-to-day we need to look through short term statistical noise to identify longer term trends. The same is true when investing.

Since ancient times, the ability to heal quicker has been revered. In Greek mythology Prometheus used it to survive Zeus’ harsh punishment. The story goes that Prometheus had given humans the gift of fire. For this, Zeus punished him by tying him to a rock and having an eagle eat his liver. As Zeus knew, Prometheus’s liver would grow back overnight so he would have to relive the horror with the eagle each day. You have to hand it to mythical deity – they knew how to devise retribution.
Luckily another Greek hero, Hercules, shot the eagle and Prometheus’s survival became legend. The recent downturn in markets highlights the need for investors to have an investment strategy that, like Prometheus, can recover quickly and show resilience when times are toughest.
Identifying these types of investments has been a focus of investors since Benjamin Graham, Warren Buffett’s mentor, penned Security Analysis in 1934. Such companies show resilience by falling less in a downturn and recovering to previous highs quicker than other companies.
A new research paper from VanEck shows that an international portfolio of Quality companies has these characteristic: Read here
In summary the paper finds:
- Quality companies have demonstrated outperformance during periods of economic slowdown, such as the period we are now in, and over the long term;
- MSCI, the world’s largest index provider and creator of the first international index, created a Quality Index based on the characteristics Graham demanded a company meet to consider for inclusion in a portfolio; and
- VanEck’s MSCI World ex Australia Quality ETF (QUAL) and its hedged version QHAL, are ASX-traded ETFs that provide investors with an international equity portfolio of 300 Quality companies with these fundamentals, namely:
- High ROE;
- Stable year-on-year earnings growth; and
- Low financial leverage.
Researchers at MSCI analysed over 35 years of data and found that its Quality Index traditionally has its strongest relative performance during economic downturns. These downturns were characterised by either falling inflation / slowing growth or rising inflation / slowing growth. We are in a slow growth environment right now and research shows Quality outperforms in these times because of its resilience and ability to recover.
A measure called ‘drawdown’ demonstrates both the depth of a fall from an historical peak and the pace of the recovery to a new peak. The chart below shows the drawdown of the MSCI World ex Australia Quality Index versus the broader MSCI World ex Australia Index for the past 15 years, capturing the period pre-GFC through to the current crisis. In summary the chart shows:
- During the GFC:
- The maximum drawdown of the Quality Index was 24.28% versus the benchmark’s much bigger fall of 38.41%
- The pace of recovery of the Quality Index was eight months faster.
- To date in the COVID-19 crisis:
- The maximum drawdown of the Quality Index has been 7.1% versus the much benchmark’s much bigger fall 12.8%.
Drawdown – 1 April 2005 to 31 March 2020
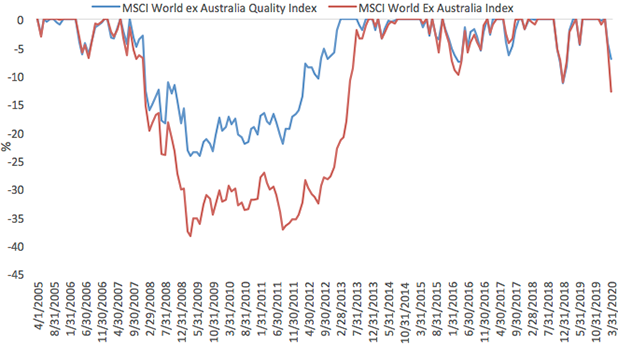
Source: Morningstar Direct, MSCI. Results are calculated monthly and assume immediate reinvestment of dividends but do not include fees and other costs with an investment in the fund. You cannot invest in an index. Past performance is not a reliable indicator of future performance of the indices, QUAL or QHAL.
The Quality factor tends to be more defensive, generating its most sustained relative outperformance in weaker macroeconomic environments.
How companies are included in MSCI’s Quality Index and the investment philosophy supporting its index are also included in the VanEck paper. In The Intelligent Investor (1973), the book Warren Buffett calls “the best book about investing ever written”, Benjamin Graham said investors should demand from a company “a sufficiently strong financial position and the potential that its earnings will at least be maintained over the years.”
In the book, Graham defines a strong financial position as one whose long-term debt does not exceed current net assets and high return on equity (ROE). Graham argues that the best way to determine whether earnings will be maintained is to examine the earnings of the company over the past ten years.
The practical application of this means sifting through companies to separate those that have strong financials from those that don’t. It would be impossible for Australian investors wanting to diversify internationally to analyse and identify these characteristics for each company around the developed world.
MSCI does the work for us. They analyse all the stocks in its global universe and identify the companies with the strongest fundamentals for inclusion in its Quality indices.
According to MSCI, "Quality growth companies tend to have high ROE, stable earnings that are uncorrelated with the broad business cycle, and strong balance sheets with low financial leverage."
MSCI’s description matches the key characteristics Graham insisted investors should demand from companies. MSCI’s philosophy and research is the basis for the MSCI World ex Australia Quality Index, the index tracked by VanEck Vectors MSCI World ex Australia Quality ETF (QUAL).
QUAL, and its hedged version QHAL are cost effective strategies that invest in the top 300 Quality companies identified by MSCI.
Australian investors can invest in an international portfolio that can demonstrate Prometheus’s healing power and resilience, with a single trade on ASX. Since its inception on ASX, QUAL has outperformed the international benchmark all trailing time periods.
QUAL Performance to 31 March 2020

*Inception date is 29 October 2014
Source: Morningstar Direct, VanEck. The chart above shows past performance of QUAL and of the MSCI World ex Australia Index. Results are calculated to the last business day of the month and assume immediate reinvestment of distributions. QUAL results are net of management fees and other costs incurred in the fund, but before brokerage fees and bid/ask spreads incurred when investors buy/sell on the ASX. Returns for periods longer than one year are annualised. Past performance is not a reliable indicator of future performance of the indices, QUAL or QHAL.
IMPORTANT NOTICE: This information is issued by VanEck Investments Limited ABN 22 146 596 116 AFSL 416755 (‘VanEck’) as responsible entity and issuer of the VanEck Vectors MSCI World ex Australia Quality ETF and VanEck Vectors MSCI World ex Australia Quality (Hedged) ETF. It is intended for financial professionals only. This is general information about financial products only and not personal financial advice. It does not take into account any person’s individual objectives, financial situation or needs. Before making an investment decision in relation to an ETF, you should read the relevant PDS and with the assistance of a financial adviser consider if it is appropriate for your circumstances. The PDSs are available at www.vaneck.com.au or by calling 1300 68 38 37. The funds are subject to investment risk, including possible loss of capital invested. Past performance is not a reliable indicator of future performance. No member of the VanEck group of companies gives any guarantee or assurance as to the repayment of capital, the payment of income, the performance, or any particular rate of return from any ETF.
QUAL and QHAL invest in international markets. An investment in QUAL or QHAL has specific and heightened risks that are in addition to the typical risks associated with investing in the Australian market. These include currency risks from foreign exchange fluctuations, ASX trading time differences and changes in foreign laws and regulations including taxation.
QUAL and QHAL are indexed to a MSCI index. The ETFs are not sponsored, endorsed, or promoted by MSCI, and MSCI bears no liability with respect to QUAL or QHAL or the MSCI Index. The PDSs contain a more detailed description of the limited relationship MSCI has with VanEck and the ETFs.
Published: 17 April 2020