The Chinese Equity Market Paradox
During the historic post-GFC Bull Run, US equity returns far outstripped the growth in the US economy. However, in China, where GDP grew at a record pace, equity market returns were low. This is the Chinese Equity Market Paradox.
As China’s influence on the global markets and economy grows, investors will need to increase their exposure to China equities and overcoming the Chinese Equity Market Paradox will help you in the new world.
Before COVID-19 brought global commerce to a screeching halt earlier this year, the US economy was enjoying record unemployment, surging energy production and overall economic growth averaging 2.3% in the decade through 2019. There was broad consensus among economists that growth was poised to exceed 3% in 2020. With such strong macroeconomic backdrop, the US stock market was enjoying its longest bull market on record. Its aggregate market capitalisation more than doubled in a decade, from US$15 trillion at the start of 2009 to more than US$36 trillion by the end of 2019. Consequently, investors who bet on a US stock market rebound following the Great Financial Crisis by simply owning a fund tracking a broad market benchmark were handsomely rewarded, earning annualised returns of almost 11% per year, excluding dividends1.
China’s economy, on the other hand, grew over three times faster than the American economy on an annualised basis between 2009 and 2019, more than doubling in size in just a decade. Its equity market, the world’s second largest, also grew in size by 138%, almost the same amount as the US stock market. Investors who bet on rising Chinese stocks over the same period, hoping to harness the country’s remarkable growth were, however, bitterly disappointed. In fact, the average investor owning the broad Chinese market through a fund tracking a passive, total market benchmark, would have earned returns of just 1.6% per year, failing to keep up with the country’s rate of inflation2. We refer to this phenomenon as the ‘Chinese Equity Market Paradox.’
Figure 1. The Chinese Equity Market Paradox
|
United States
|
China
|
|||||||
|
Real GDP Growth
|
Total M. Cap of Equity Market in Trillions of USD at End of Year
|
Growth of Total Market Cap
|
Russell 3K P. Rtn. (USD)
|
Real GDP Growth
|
Total M. Cap of Equity Market in Trillions of USD at End of Year
|
Growth of Total Market Cap
|
CSI China All Sh. P. Rtn. (USD)
|
|
|
2009
|
-2.5%
|
15,077,285,740,000
|
30.1%
|
25.5%
|
9.4%
|
3,573,152,460,000
|
100.9%
|
106%
|
|
2010
|
2.6%
|
17,283,451,680,000
|
14.6%
|
14.8%
|
10.6%
|
4,027,840,300,000
|
12.7%
|
-0.3%
|
|
2011
|
1.6%
|
15,640,707,040,000
|
-9.5%
|
-0.9%
|
9.6%
|
3,412,108,290,000
|
-15.3%
|
-24.7%
|
|
2012
|
2.2%
|
18,668,333,210,000
|
19.4%
|
12.3%
|
7.9%
|
3,697,376,040,000
|
8.4%
|
8.0%
|
|
2013
|
1.8%
|
24,034,853,520,000
|
28.7%
|
30.9%
|
7.8%
|
3,949,143,490,000
|
6.8%
|
8.4%
|
|
2014
|
2.5%
|
26,330,589,190,000
|
9.6%
|
10.5%
|
7.3%
|
6,004,947,670,000
|
52.1%
|
42.2%
|
|
2015
|
2.9%
|
25,067,539,600,000
|
-4.8%
|
-1.5%
|
6.9%
|
8,188,019,320,000
|
36.4%
|
26.8%
|
|
2016
|
1.6%
|
27,352,200,720,000
|
9.1%
|
10.4%
|
6.7%
|
7,320,738,379,789
|
-10.6%
|
-20.0%
|
|
2017
|
2.2%
|
32,120,702,650,000
|
17.4%
|
17.9%
|
6.8%
|
8,711,267,220,000
|
19.0%
|
8.3%
|
|
2018
|
2.9%
|
30,436,313,050,000
|
-5.2%
|
-7.8%
|
6.6%
|
6,324,879,760,000
|
-27.4%
|
-34.7%
|
|
2019
|
2.3%
|
36,329,851,880,000
|
19.4%
|
28.5%
|
6.0%
|
8,515,504,380,000
|
34.6%
|
30.5%
|
|
Cumltv.
Growth |
21.8%
|
141%
|
181%
|
108%
|
138%
|
17.1%
|
||
|
Ann. Gr.
(10 Yrs) |
2.3%
|
9.2%
|
10.9%
|
7.6%
|
9.1%
|
1.6%
|
||
Sources: International Monetary Fund (GDP), World Federation of Exchanges (Market Capitalisation), Bloomberg (Index Returns)
What explains this dichotomy between China’s remarkable economic growth and such paltry stock market returns? The simple answer: the degree to which the benchmark is composed of—and often overweight—State Owned Enterprises (SOEs). While SOEs abound in emerging markets generally, nowhere else in the world are they so prevalent as in China, largely as a result of the country’s unique privatisation program in the early 1990s, as documented in MarketGrader’s recently published paper on the subject. In fact, SOEs today account for 55% of China’s aggregate market capitalisation, with only a little more than a third of their shares freely tradable. The remaining two thirds are owned, and closely controlled, by the central government, local governments or government-controlled entities. The CSI 300 Index, China’s largest and most widely followed benchmark, which tracks the country’s 300 largest companies, has a whopping 69% of its aggregate weight in SOEs. Even the MSCI China has a 50% weight in SOEs, given that its goal is also to track China’s equity market passively, which it achieves by employing a market capitalisation weighted methodology. The problem with such indexes isn’t that they don’t do a good job of benchmarking China’s equity market but that, in fact, they work too well; they track the makeup of China’s equity market faithfully, which explains why SOEs account for so much of their weight. Figure 2 illustrates how poorly investors have done by owning an index fund tracking one of these benchmarks. Not surprisingly, their performance has closely tracked that of the CSI SOE Composite.
Figure 2. $100 Investment in China’s Benchmarks a Decade Ago (March 2010 – March 2020)
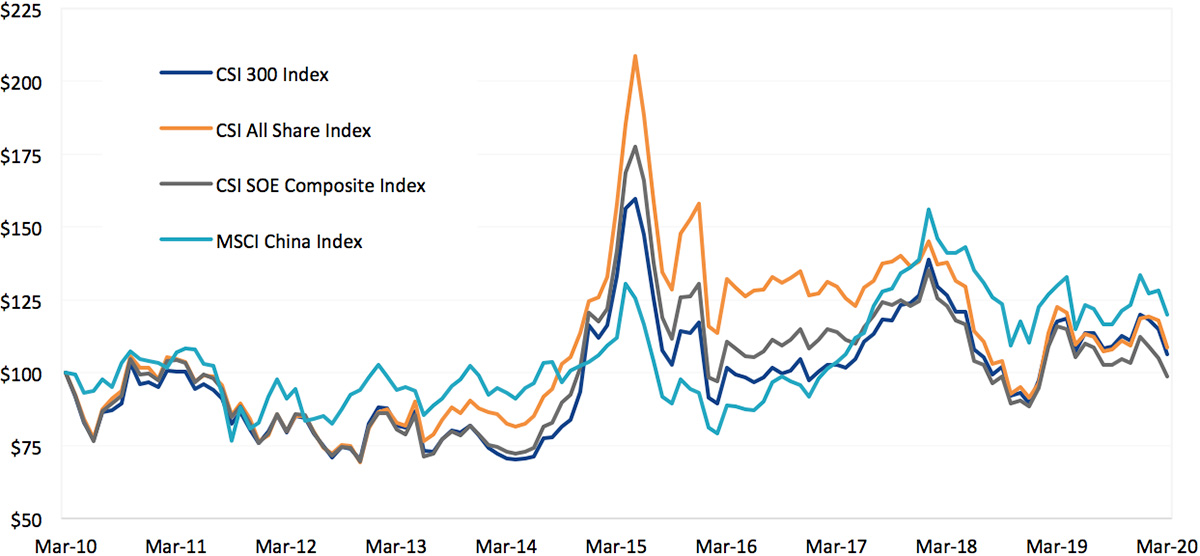
Sources: China Securities Index Co. (CSI), Bloomberg. Performance shown is of various indices, not funds. You cannot invest directly in an index. Results are calculated to the last business day of the month and assume immediate reinvestment of all dividends and exclude costs associated with investing in a fund.
The State-Owned Enterprise Dilemma
The problem faced by investors who own SOEs can be traced to the role these companies play in China’s economy. Given the fact that almost two thirds of their shares, in the aggregate, are owned by the state or state-related entities, SOEs hew to government directives more closely than they do to private shareholders’ goal of maximising shareholder value. At the outset of China’s privatisation program, the state made it clear that it intended to maintain majority ownership in its SOEs partly for economic reasons (to benefit from the upside in the appreciation of their shares) but also, in no small part, to ensure they played a central role in carrying out the government’s industrial and social policies. In the early days of China’s economic reform policies, especially during the 1980s and early 1990s, SOEs were China’s largest employers (excluding rural workers). Besides providing jobs, SOEs were also tasked with providing health care, social services, social security and retirement benefits to their employees and their families. They continue to play this role today, even though private enterprise now accounts for approximately 60% of China’s labor force.
SOEs in China are also tasked with implementing the state’s centrally planned industrial policies and, increasingly these days, its broader political goals. A prime example of this is the country’s “Belt and Road Initiative (BRI),” China’s vast infrastructure development program designed to broaden its commercial—and political—sphere of influence as far as Europe, the Middle East, and Africa and also throughout the Asia Pacific region. According to a study by Australia’s Lowy Institute, “Chinese SOEs contracted about half of BRI projects by number and more than 70% by project value.”3BRI projects involve Chinese firms in the construction of roads and railways, in the development of ports, the construction of nuclear power plants, in oil and gas projects and, importantly, in supplying credit. While BRI might seem like a commercial bonanza for SOEs given the magnitude and scope of the program, a closer look at their numbers instead reveals a gross misallocation of capital, as illustrated in Figures 3 and 4. For public shareholders of SOEs, including unsuspecting foreign shareholders investing in China through the country’s traditional benchmarks, this translates into mediocre margins, poor cash flow, excessive leverage and, unsurprisingly, poor returns on equity.
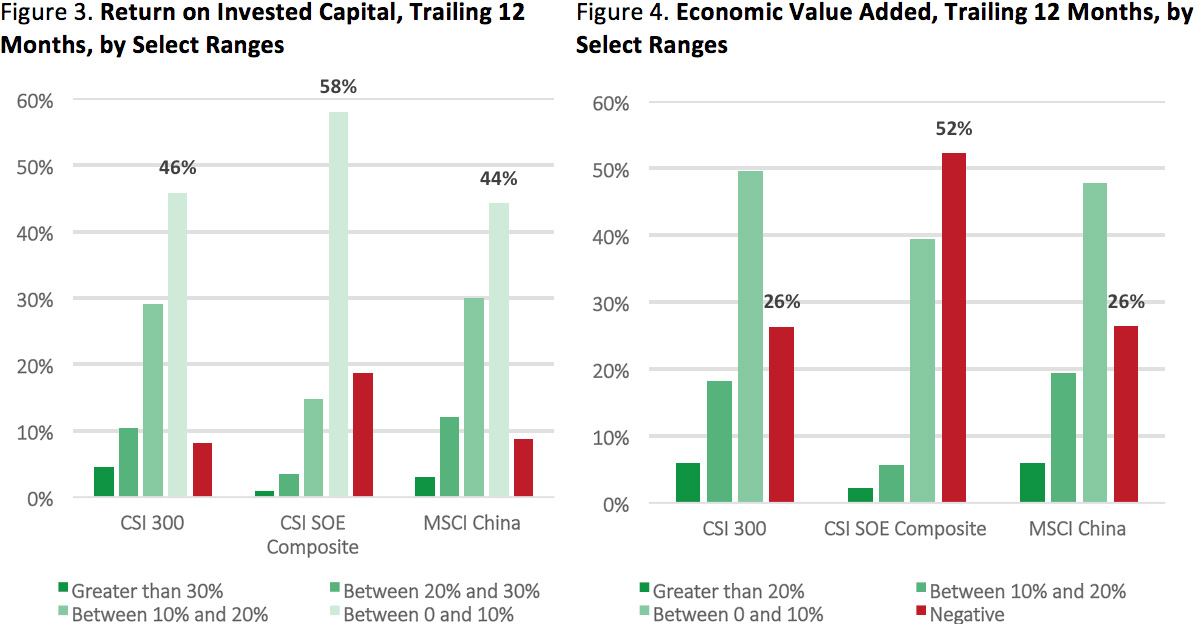
Sources: FactSet, China Securities Index Co. (CSI), MarketGrader.
MarketGrader’s Approach: Focused on Stock Selection
Investors interested in China’s stock market can avoid the pitfalls of overexposure to SOEs by following a different set of benchmarks that are more attuned to the true drivers of Chinese economic growth. Many would argue that the simplest way to achieve this would be to exclude SOEs from an investment portfolio, but this is a blunt solution to a problem that requires a finer approach; especially because there are plenty of high quality SOEs in dynamic areas of China’s economy which could prove beneficial for investors. MarketGrader’s approach to the Chinese equity market is to focus on stock selection based on company quality. More specifically, MarketGrader selects companies that are growing at a faster rate than the overall economy and that possess attributes associated with sound capital stewardship and robust fundamentals, but whose future value is not yet reflected in their share price. Essentially, the stock selection can be summarised as a GARP (growth-at-a-reasonable-price) approach with a goal of identifying what we refer to as ‘growth compounders,’ or companies that we believe are the most consistent creators of long-term shareholder value.
Consistent with these beliefs, in 2015 MarketGrader launched a series of Chinese indices whose goal is to benchmark the performance of growth compounders within Chinese equities, and hence the capital appreciation opportunities in one of the world’s fastest growing economies. Among these is the CSI MarketGrader China New Economy Index, which, in addition to its focus on company selection, limits its exposure to four economic sectors: consumer discretionary, consumer staples, health care, and technology. We call these China’s ‘New Economy’ sectors, as we expect companies from these sectors to be the primary drivers of the country’s future growth. For more about our views on China’s transformation from a manufacturing and export-based economy to a consumer, services and technology driven economy please refer to our 2018 paper titled ‘China’s Next Chapter.’
The process of identifying China’s growth compounders begins with the analysis of every publicly traded company in the equity universe, which for China totals more than 2,700 companies. MarketGrader’s analysis applies 24 fundamental metrics to every company, dividing all indicators into four categories: Growth, Value (GARP part of the analysis), Profitability and Cash Flow (Quality part of the analysis). Each one of the 24 indicators is assigned an individual grade and all 24 grades are aggregated into a final MarketGrader Score (MG ScoreTM) between zero and 100. MarketGrader then rates as ‘BUY’ all of those with an MG ScoreTMgreater than 60 and as ‘SELL’ all of those with an MG ScoreTMbelow 50. The remaining companies are rated ‘HOLD’. The grading system’s goal is to identify sustainable growth compounders with the following characteristics:
- Consistent top to bottom line growth—not just explosive short-term growth—with sustainable margins and high cash flow generation.
- A sound capital structure that doesn’t impair operating growth, combined with high returns on invested capital and low capital intensity.
- Reasonable valuations relative to sustainable growth rates, and not based just on absolute, out of context, valuation multiples.
Since MarketGrader began covering the Chinese equity market, its BUYs have averaged 16% of the universe and its SELLs have averaged 67%. Figure 5 shows MarketGrader’s breakdown of all companies under coverage in its Chinese investable universe by MarketGrader Score and by rating, while Figure 6 illustrates the rating makeup of the CSI MarketGrader China New Economy index relative to the broad benchmarks referenced throughout this article.
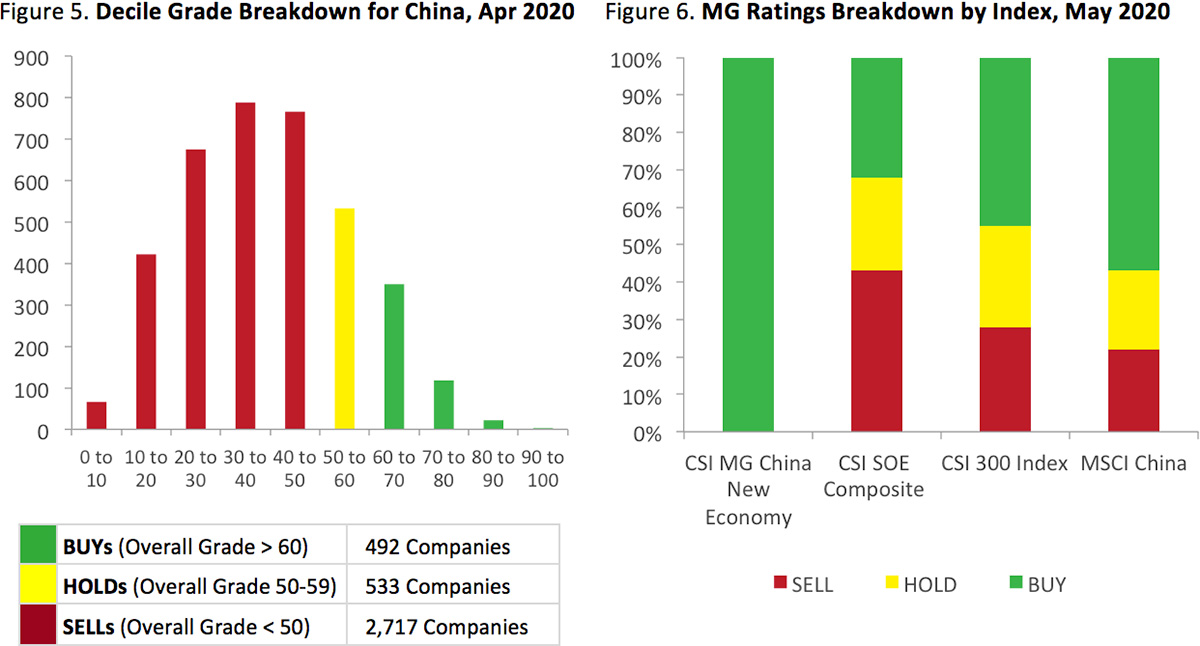
Source: MarketGrader
As a result of MarketGrader’s methodology, its Chinese indices are made up of companies with much better returns on invested capital and, consequently, superior returns on shareholder equity. Unsurprisingly, over time this has translated into superior price appreciation, which may be seen in Figure 7.
Figure 7. Cumulative Price Return in AUD for CSI MarketGrader China New Economy Index vs. Select Chinese Benchmarks, 2010 – 2020
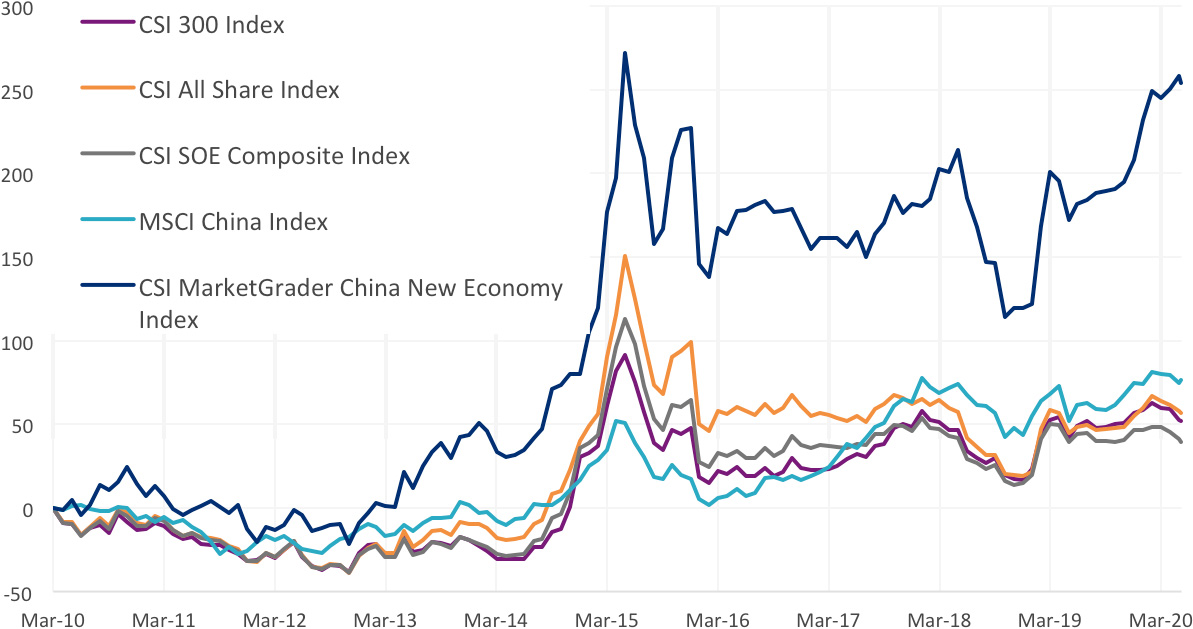
Source: Bloomberg. The chart shows the performance of various indices and not ETFs. You cannot invest directly in an index. Results are calculated to the last business day of the month and assume immediate reinvestment of all dividends and exclude costs associated with investing in an ETF. Past performance is not a reliable indicator of current or future performance of the indices or CNEW, which may be lower or higher. The CSI MarketGrader China New Economy Index was launched on March 20, 2015. Data prior to the launch date is hypothetical based on back-testing.


Published: 26 June 2020
IMPORTANT NOTICE
This information is prepared in good faith by VanEck Investments Limited ABN 22 146 596 116 AFSL 416755 (‘VanEck’) as the responsible entity and issuer of VanEck Vectors China New Economy ETF (‘the Fund’).
This information is general advice about a financial product and not personal financial advice. It does not take into account any person’s individual objectives, financial situation or needs. Before making an investment decision investors should read the product disclosure statement and with the assistance of a financial adviser consider if it is appropriate for their circumstances. A copy of the PDS is available at www.vaneck.com.au or by calling 1300 68 38 37.
An investment in Chinese securities has heightened risks compared to investing in the Australian market. See the PDS for details of the key risks. No member of the VanEck group guarantees the repayment of capital, the payment of income, performance, or any particular rate of return from the Fund.
The Fund tracks the CSI MarketGrader China New Economy Index. "MarketGrader" And “CSI MarketGrader China New Economy Index” are trademarks of MarketGrader.com Corporation. MarketGrader does not sponsor, endorse, sell or promote the Fund and makes no representation regarding the advisability of investing in the Fund. The inclusion of a particular security in the Index does not reflect in any way an opinion of MarketGrader or its affiliates with respect to the investment merits of such security.
© 2020 VanEck Australia Pty Ltd
1Based on price-only returns for the Russell 3000 Index. Source: Bloomberg.
2Based on price-only returns for the CSI All Share Index. Source: Bloomberg. China’s annualised inflation rate, as measured by the annual increase in consumer prices for the decade ended in 2019, was 2.5%. Source: World Bank.
3‘China’s Belt and Road Initiative, from the inside looking out.’ July 2019. The Lowy Institute.