Why you should move beyond traditional market capitalisation
The concept of 'market capitalisation' was devised for its ease of calculation. It became 'the benchmark' to quantify share market performance not because it was the best method, but solely because it was the first. More and more investors are questioning the wisdom of tracking market capitalisation indices that have fundamental flaws for investing purposes.
Benchmark market cap weighted indices are not always something to which investors should strive. The fact that these indices were the first of their kind is the only reason they are recognised as 'the benchmark'. Unlike modern 'benchmarks' it is not because they are based on industry feedback, academic diligence or inherent merit.
Early index construction involved weighting stocks based on their size. This was in an era before technology allowed the lightning speed computations that give us the live index movements today. Index providers would undertake the painstaking process of flipping through annual reports to find the shares outstanding, record stock prices and then manually multiplying them with pen and paper. It was because of the limitations of the day that there was only one method and it became a convention to measure market performance.
When passive investing became popular, the only indices available to track were these market cap weighted 'benchmarks'. Using market capitalisation as the basis of an investment product therefore became a historical accident.
When improving technology allowed more and more indices to be calculated each day, the growth was in covering as many sectors and subsectors as possible rather than in exploring different methodologies. Flaws in market capitalisation from an investment point of view, such as stock and sector concentration, were amplified as the universe of stocks got smaller, but it was a long time before anyone started addressing this.
The S&P/ASX 200 A-REIT Index, the benchmark index for Australian listed real estate investment trusts, is an example. When you look at the index, you can begin to understand the nature of the problem.
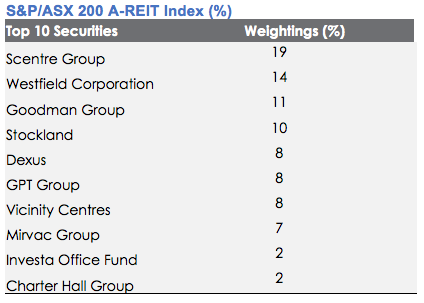
Source: Factset, as at 31 May 2017
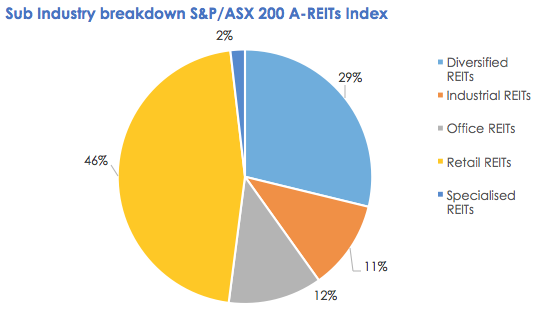
From an investor's point of view, the benchmark index has too much concentration in certain securities and sectors, in particular, the retail sector.
Aspiring to do better
Indices developed for passive investing today are more sophisticated and respond to investors' needs. As a comparable example, the index that has been adopted as the benchmark for global infrastructure securities is the FTSE Developed Core 50/50 Infrastructure Index.
FTSE consulted industry participants when it was developing this index to ensure it would meet investors' needs. As a result, one of the key differences between the FTSE benchmark index and the S&P/ASX A-REITs index series is that it limits the weights of stocks and sectors by capping so that no one stock or sector can dominate.
Without such capping, the S&P/ASX A-REIT index series is dominated by retail heavyweights Scentre Group, Westfield Corp and Vicinity Centres. Investors tracking an S&P/ASX A-REIT index are not getting a well-diversified portfolio.
With the concentration in retail A-REITS, the benchmark index has significantly underperformed the overall sharemarket and could continue to do so. That's because the retail sector is going through a very bad patch. Westfield Corp is down around 15% over the year, Scentre and Vicinity have both lost around 7%.[1] Households are struggling with high debt levels and low wages growth, so retail spending is tight. Another headwind is the increasing dominance of online traders, to be amplified when Amazon finally arrives in Australia. So, the retail sector's woes are potentially far from over.
An alternate diversified index for A-REITs
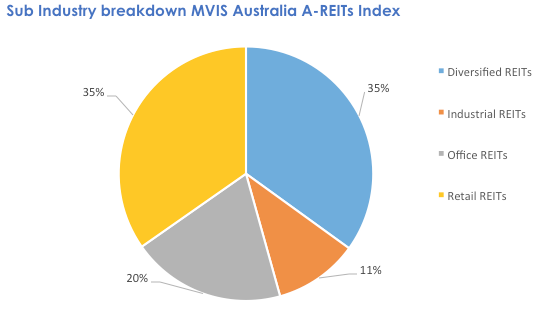
Consider if the A-REITs index capped stock weightings. Immediately you would get a more diversified index as more is allocated away from the mega sized A-REITs to smaller sized ones. The industry breakdown would change too.
That's exactly why VanEck has based its A-REIT ETF on a tailor-made index which caps stock weightings.
The MVIS Australia A-REITs Index includes only the largest and most liquid ASX-listed REITs with a maximum individual holding of 10% of the fund. Investors still have exposure to the retail sector, but it is reduced from 46% in the S&P/ASX 200 A-REIT Index to 34% with the MVIS Index. The result is investors get increased exposure to other stocks and sectors such as Goodman Group, Dexus and residential development group Mirvac.
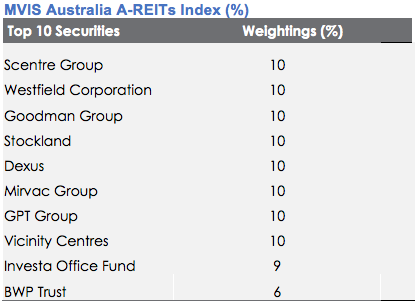
Source: Factset, as at last rebalance 9 June 2017
Measuring diversification
A way to measure the diversification of a portfolio is to calculate a Herfindahl number. This calculation is a broadly used measure to quantify concentration. When used inversely, it quantifies diversification. As at 31 May 2017, the Herfindahl number for the S&P/ASX 200 A-REIT Index was 1,069. The equivalent measure for the MVIS Australia A-REITs Index was 945 showing a lower level of concentration. Therefore MVIS Australia A-REITs Index is shown to be better diversified than the S&P/ASX 200 A-REIT Index.
Tracking the better diversified index for A-REITs
The VanEck Vectors Australian Property ETF (ASX: code MVA) tracks the MVIS Australia A-REITs Index and since its inception, in addition to providing better diversification, it has outperformed over every trailing period the S&P/ASX 200 A-REIT Index since inception.
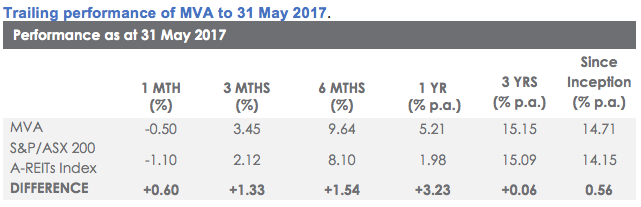
*Inception Date is 14 October 2013. The tables above show past performance of MVA and of the S&P/ASX 200 A-REITs Index. Results are calculated to the last business day of the month and assume immediate reinvestment of distributions. MVA results are net of management costs and expenses, but before brokerage fees or bid/ask spreads incurred when investors buy/sell on the ASX. Returns for periods longer than one year are annualised. Past performance is not a reliable indicator of future performance.
With its capped exposure to larger property securities, tracking the MVIS Index can help passive investors significantly reduce concentration risk and get an exposure closer to what the benchmark, we posit, would be if it were invented today.
For more information about MVA and VanEck's range of smart beta ETFs, click here.
IMPORTANT NOTICE: This information is issued by VanEck Investments Limited ABN 22 146 596 116 AFSL 416755 ('VanEck') as responsible entity and issuer of the VanEck Vectors Australian Property ETF ('Fund'). Nothing in this content is a solicitation to buy or an offer to sell shares of any investment in any jurisdiction including where the offer or solicitation would be unlawful under the securities laws of such jurisdiction. This is general information only and not financial advice. It does not take into account any person's individual objectives, financial situation or needs. Before making an investment decision in relation to the Fund, you should read the PDS and with the assistance of a financial adviser consider if it is appropriate for your circumstances. The PDS is available at www.vaneck.com.au or by calling 1300 68 38 37. The Fund is subject to investment risk, including possible loss of capital invested. Past performance is not a reliable indicator of future performance. No member of the VanEck group of companies gives any guarantee or assurance as to the repayment of capital, the payment of income, the performance, or any particular rate of return from the Fund.
The MVIS Australia A-REITs Index ('MVIS Index') is the exclusive property of MV Index Solutions GmbH based in Frankfurt, Germany ('MVIS'). MVIS makes no representation regarding the advisability of investing in the Fund. MVIS has contracted with Solactive AG to maintain and calculate the MVIS Index. Solactive uses its best efforts to ensure that the MVIS Index is calculated correctly. Irrespective of its obligations towards MVIS, Solactive has no obligation to point out errors in the MVIS Index to third parties.
[1] Bloomberg, 19/6/17


Published: 09 August 2018