You be the judge
As more and more ETFs are made available on ASX its important you are be able to assess differences between them. The most important feature to assess is the index, which drives performance. But there are four other key factors you also need to consider when judging ETFs.
In our last Vector Insights we looked at the most important factor in assessing an ETF, the index the ETF tracks. This week, we consider four additional factors investors should consider when determining which ETF to invest in. These are:
- Whether the underlying securities in the ETF are physically held;
- Assuming the ETF holds physical securities, the liquidity of those securities in the index;
- The fees, including brokerage and other transaction costs; and
- The expertise of the asset manager, including its pedigree, experience and evidence that it has the skill to track the index.
1. Whether the ETF securities are physically held
Once you understand the index, it’s critical to understand the ETF’s investment strategy. You need to determine whether the asset manager employs a direct physical replication strategy or whether they take a synthetic approach. A physical strategy involves the asset manager buying all (or a representative sample) of the securities in the index. A ‘synthetic’ approach involves investing in derivatives to get exposure to the index performance without actually holding any physical assets.
Recently the Reserve Bank of Australia (RBA) warned investors that they should be aware of some risks associated with ETFs that use synthetic strategies. According to the RBA, ETFs that use derivatives "rely on a counterparty paying the return of the ETF... so there is some risk that the counterparty could default or not be able to pay the return." There is also a risk the derivative will not perform in line with the index.
Investors should avoid synthetic ETFs unless they understand and are comfortable with the type of derivatives being used and the associated risks that the particular derivatives and counterparties carry.
2. The liquidity of the securities in the index the ETF tracks
There are two aspects to the liquidity of an ETF:
- Tradability - a liquid investment can be readily bought and converted to cash;
- Impact on price - a liquid investment can be bought or sold at its fair value without a significant premium or discount.
We discuss each of these in more detail in A Primer on Liquidity.
The first – tradability – is a feature of ETFs as they can be readily bought and sold by investors on the ASX. So in this context ETFs are liquid investments.
The second – impact on price – should be considered in the context of the individual securities in the index that the ETF is seeking to track. The relevant question for investors to ask is whether the ETF investment manager can readily buy and sell the underlying securities at a fair price and not push the price of the asset up or down in doing so.
There are a number of ways to assess a security’s liquidity and therefore filter out stocks for the index, including:
- its size (the larger the company or the bigger the bond issue, the better); and
- its trading volume (the higher the volume, the better).
3. The fees, including brokerage and other transaction costs
One of the features of ETFs are their low costs and according to Zenith, the average ETF management cost is currently only 0.47% per annum1. This means the ETF will cost you $4.70 in annual fees for every $1,000 you invest. However it’s not just the headline management costs you pay that matter. Investors should be aware of other fees including:
- transaction costs inside the ETF such as transactional and operations costs which can be found in the ETF’s Product Disclosure Statement (PDS)
- costs outside the ETF including brokerage which is paid to your broker and the buy/sell spread at the time you trade on ASX.
4. The expertise of the asset manager, including its pedigree, experience and its skill
As for any institution you entrust your money to, it’s important you have confidence in the ETF issuer. You can assess them in a number of ways including determining their history, how long they have been investing money and how long they have been issuing ETFs, including both here and overseas.
In regards to their investment skill, the goal of an ETF is to track the performance of a specific market index. It is important to investigate how good the ETF issuer is at tracking its index when adjusted for the fees associated with the ETF which are not incurred by the index.
The difference in performance should usually be small, in the range of one percent. However, a variety of factors can sometimes conspire to open a gap of several percentage points. In order to avoid such an unwelcome surprise, investors should seek ETF issuers that have a history of tracking their respective indices closely, which means tracking within just a few basis points of the index after adjusting for fees.
You would expect an ETF issuer to report this information on their website. If they don’t, alarm bells should ring.
Example
Let’s now use these insights to assess the VanEck Vectors Australian Equal Weight ETF (ASX code: MVW) which tracks the MVIS Australia Equal Weight Index which we assessed last time.
Assessing the VanEck Vectors Australian Equal Weight ETF
1. Does MVW hold physical securities?
Yes. MVW employs a physical replication investment strategy and is backed by assets which it holds directly in the ETF’s portfolio. There are no synthetic elements involved. MVW owns the 79 securities in the MVIS Australia Equal Weight Index in the same proportion as the index. MVW is transparent and its holdings are published on the VanEck website daily for all to see.
2. Are the securities of the index liquid?
Yes. An important feature of the MVIS Australia Equal Weight Index’s design is that it only invests in the largest and most liquid securities in the Australian market by applying strict liquidity screening rules as the first step in the index selection criteria. It does not simply equal weight the S&P/ASX 200 Index as many securities at the tail end of that index are illiquid. Currently, MVIS Australia Equal Weight Index includes 79 Australian companies.
3. How do MVW’s fees compare to other ETFs?
According to MVW’s PDS, its management costs are just 0.35% per annum, less than the average management fee for ETFs of 0.47% as assessed by Zenith.1 The fee also compares favourably to other smart beta Australian equity ETFs.
According to MVW’s PDS its transactional and operational costs associated with trading the portfolio are 0.04% per annum. Again this compares favourably to other Australian equity ETFs.
According to the most recent ASX report, MVW’s average buy/sell spread is 0.09%, or $0.90 per $1,000 traded, which is among the lowest in its category.
4. VanEck’s expertise, including its pedigree and history of managing tracking closely to the index
Founded in 1955 in New York, VanEck is one of the most experienced, enduring global asset managers. Locally, VanEck is the fifth largest ETF provider, currently managing over $1.2 billion on the ASX. In the US, VanEck is the ninth largest ETF issuer and has been issuing ETFs since 2006. VanEck manages over $55 billion in assets globally.
The chart below shows how MVW has tracked in line with its index confirming the ETF manager’s ability to successfully manage the portfolio in line with the investment objective. More detail on performance is available on VanEck’s website.
Growth of hypothetical $10,000 investment
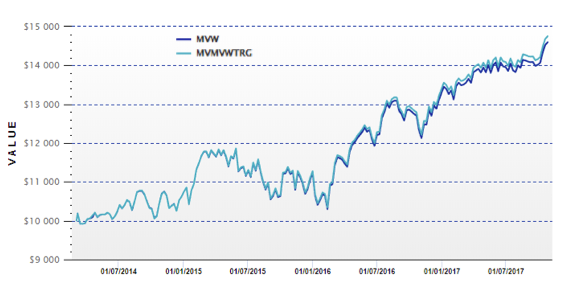
The above graph is a hypothetical comparison of performance of a $10,000 investment in the Index and the Fund from the Fund Inception Date. The performance of the Fund assumes immediate reinvestment of distributions and is net of management costs and expenses, excluding brokerage and bid/offer spreads incurred when investors buy/sell on the ASX. The Index is unmanaged and performance assumes investment at Unit Prices and the immediate reinvestment of all dividends, and excludes the costs of investing in the Fund. Results are calculated to the last business day of the month. You cannot invest directly in the Index and ASX investors cannot invest in the Fund at Unit Prices. The above performance information is not a reliable indicator of current or future performance of the Index or Fund, which may be lower or higher.
You now have the necessary tools to judge ETFs and the index that underlies the ETF. By doing some simple homework you can find the ETF that is right for you.
Important notice
This information is issued by VanEck Investments Limited ABN 22 146 596 116 AFSL 416755 (‘VanEck’) as responsible entity of the VanEck Vectors Australian Equal Weight ETF (MVW) (‘Fund’). This is general information only and not financial advice. It is intended for use by financial services professionals only. It does not take into account any person’s individual objectives, financial situation nor needs. Before making an investment decision in relation to the Fund, you should read the PDS and with the assistance of a financial adviser and consider if it is appropriate for your circumstances. The PDS is available at www.vaneck.com.au or by calling 1300 68 38 37. The Fund is subject to investment risk, including possible loss of capital invested. Past performance is not a reliable indicator of future performance. No member of the VanEck group of companies gives any guarantee or assurance as to the repayment of capital, the payment of income, the performance or any particular rate of return from the Fund.
MVIS Australia Equal Weight Index (‘Equal Weight Index’) is the exclusive property of MV Index Solutions GmbH based in Frankfurt, Germany (‘MVIS’). MVIS makes no representation regarding the advisability of investing in the Fund. MVIS has contracted with Solactive AG to maintain and calculate the Equal Weight Index. Solactive uses its best efforts to ensure that the Equal Weight Index is calculated correctly. Irrespective of its obligations towards MVIS, Solactive has no obligation to point out errors in the Equal Weight Index to third parties.
1https://www.zenithpartners.com.au/Reports/FileAttachmentGeneral/d2a5db43-b2a8-e711-80c2-0003ff8c152e


Published: 09 August 2018