The sweet spot of Australian equities
Last year the S&P and the ASX celebrated 20 years of its S&P/ASX index series. This year they celebrated 20 years since an ETF tracked one of these indices. Since then ETFs on ASX have proliferated. Here we provide some insight, comparing the market capitalisation indices that make up the S&P/ASX series: S&P/ASX 200, S&P/ASX 50, S&P/ASX MidCap 50 and the S&P/ASX Small Ordinaries Index. The results may surprise you.
According to S&P, “Since its debut in April 2000, the S&P/ASX Index Series has helped to define the Australian equity market. As Australia’s most widely followed market indicator, the S&P/ASX 200 serves as the de facto measure of the value and performance of the nation’s stock market. Market peaks and valleys are defined by the level of the S&P/ASX 200.” April 2000 also marked the introduction of other size segment indices too, the S&P/ASX 50, S&P/ASX Small Ordinaries, and S&P/ASX MidCap 50.
Since their launch, one index has consistently shone above the others. The S&P/ASX MidCap 50 index outperformed both Australian large and small-caps and the broad S&P/ASX 200 Accumulation benchmark, as the chart below shows.
Chart 1: Performance April 2000 to September 2021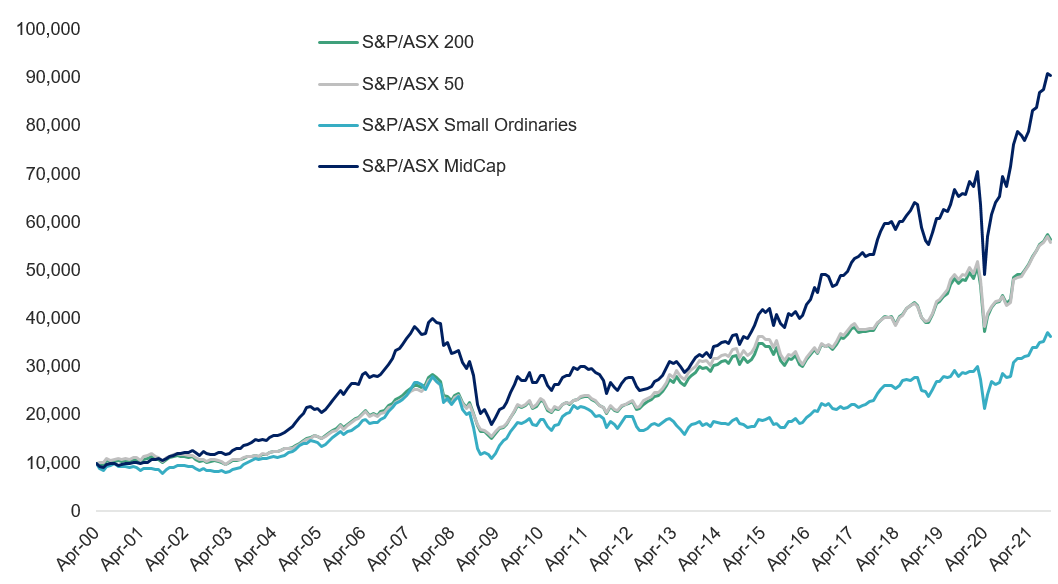
Source: VanEck, Morningstar, since inception of S&P/ASX index series (4 April 2000) to 30 September 2021. Rebased to 10,000. Results are calculated to the last business day of the month and assume immediate reinvestment of all dividends and exclude costs associated with investing in MVE. You cannot invest directly in an index. Past performance is not a reliable indicator of future performance.
Australian mid-caps have led the pack when it comes to investment returns. Mid-caps offer the best of both small and large-caps. They represent a mix of established and still developing companies and a balance between the spirit and youth of small-caps and the stability of large companies.
Some of the best-known large-caps started as small-caps then grew to be titans of their industry. Finding a hidden gem is one of the greatest potential benefits of investing in small companies but it also comes with a lot more risk because they can fail spectacularly.
At the other end of the spectrum, large-caps have more stability than mid or small-caps because of their size. Because of this, they are often less agile than their mid-and small-cap peers. The S&P/ASX 200 is dominated by a handful of large-cap stocks including the big four banks and two big miners.
Mid-caps sit in the ‘sweet spot’ between large- and small companies.
Considering returns and risks
The following table shows the trailing performance of the S&P/ASX MidCap 50 Index in comparison to other key S&P/ASX indices since their launch in April 2000 to 30 September 2021. The S&P/ASX MidCap 50 Index delivered the best performance over 1,3,5,10,15 and 20-year periods.
|
|
YTD (%) |
1 Year (%) |
3 (%) |
5 (%) |
10 Years (%) |
15 Years (%) |
20 Years (%) |
|
S&P/ASX 200
|
14.83 |
30.56 |
9.65 |
10.42 |
10.80 |
6.84 |
9.01 |
|
S&P/ASX 50
|
15.16 |
30.33 |
9.40 |
10.06 |
10.54 |
6.89 |
8.75 |
|
S&P/ASX |
14.57 |
30.41 |
9.43 |
10.18 |
7.69 |
4.26 |
7.94 |
|
S&P/ASX MidCap 50 |
14.67 |
34.03 |
12.37 |
13.18 |
13.95 |
7.79 |
11.37 |
Investors may worry this return might come with too much risk. The Sharpe ratio combines the return measure with a volatility (risk) measure to quantify the relationship between the returns and risk. The greater the value of the Sharpe ratio, the better the risk adjusted return. The table below shows that the S&P/ASX MidCap 50 Index has the delivered the best risk-adjusted returns over 1, 3, 5, 10, 15 and 20 years.
Table 2: Sharpe ratio of the S&P/ASX index series
|
|
1 Year |
3 Years |
5 Years |
10 Years |
15 Years |
20 Years |
|
S&P/ASX 200
|
2.36 |
0.59 |
0.73 |
0.66 |
0.35 |
0.44 |
|
S&P/ASX 50
|
2.20 |
0.59 |
0.73 |
0.66 |
0.35 |
0.43 |
|
S&P/ASX Small Ordinaries |
2.28 |
0.53 |
0.63 |
0.36 |
0.18 |
0.31 |
|
S&P/ASX |
2.57 |
0.63 |
0.75 |
0.74 |
0.37 |
0.54 |
Let’s walk through some of the other differences between the indices.
S&P/ASX Index Series - Top 10 holdings
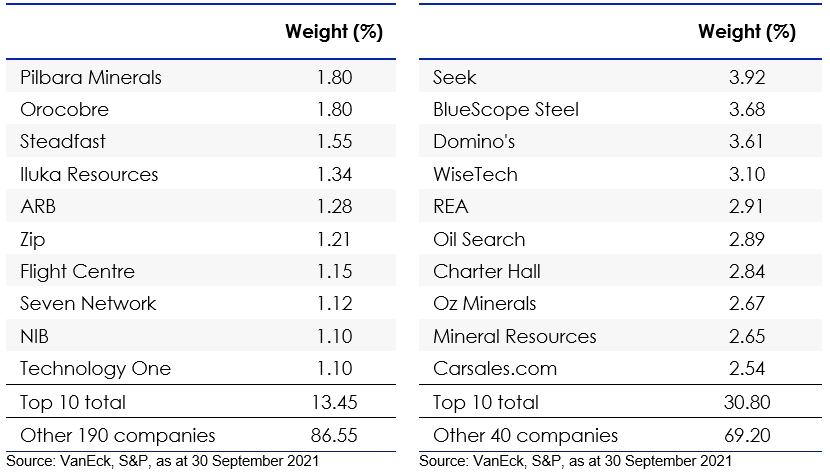
Below you can see the top 10 companies of each index. In the S&P/ASX 200 and S&P/ASX 50 many stocks have more than 5% individual exposure. The top 10 make up over 40% of the index. Investors seeking diversification from a portfolio of 200 or 50 stocks would not expect concentration. In these indices, the small sized companies outside of the top 10 would not have much impact on performance. Compare this to the S&P/ASX Small Ordinaries and the MidCaps, in which the smaller size of the top 10 allows for greater representation elsewhere in the portfolio.
Table 3: Top 10 holdings S&P/ASX 200 Table 4: Top 10 holdings S&P/ASX 50
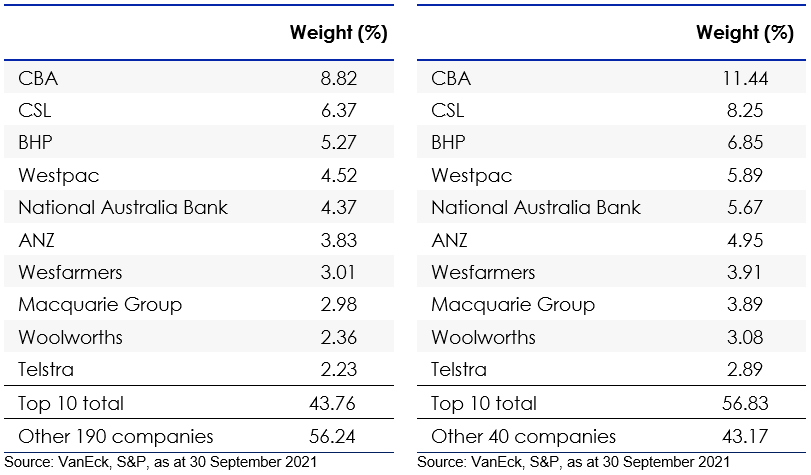
Table 5: Top 10 holdings S&P/ASX Small Ordinaries Table 6: Top 10 holdings S&P/ASX MidCap 50
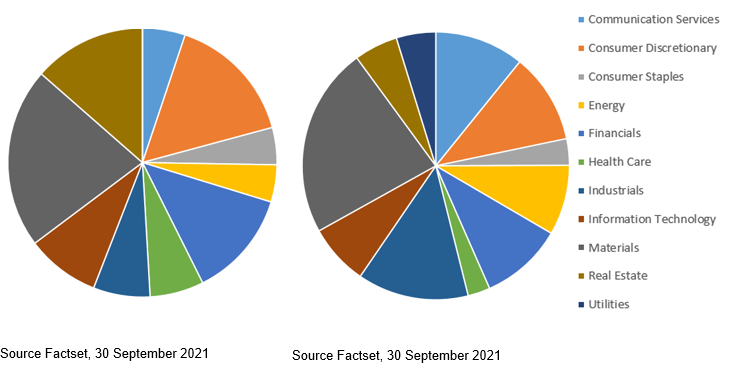
S&P/ASX Index Series – Sector allocation
The issue of concentration is also evident when you consider compare the sector allocation of each index. The S&P/ASX 200 and S&P/ASX 50 each have over 30% allocated to just one sector, financials. Again, both the S&P/ASX Small Ordinaries and the S&P/ASX MidCap 50 look to have a better diversification as they have a better representation of sectors. The S&P/ASX Small Ordinaries however does not include a utilities company. The S&P/ASX MidCap 50 includes all sectors of the Australian economy.
Chart 2: S&P/ASX 200 sector allocation Chart 3: S&P/ASX 50 sector allocation
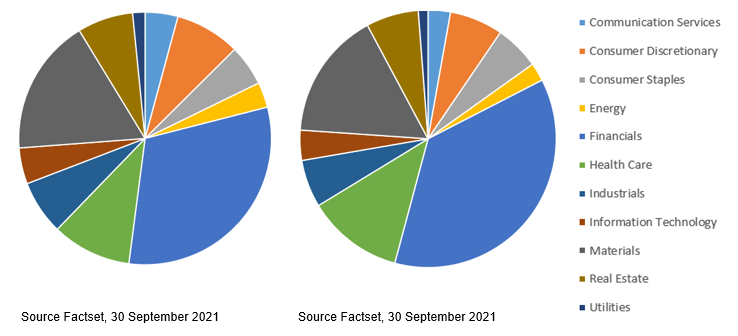
Chart 4: S&P/ASX Small Ordinaries sector allocation Chart 5: S&P/ASX MidCap 50 sector allocation
S&P/ASX Index Series – Fundamentals
You can see in Table 7 below, the S&P/ASX MidCap 50 sits in the middle of mid- and large-caps in terms of growth and quality metrics such as return on equity (ROE), debt levels and earnings and sales growth. On a price-to-book and a price-to-sales metric, the S&P/ASX MidCap 50 Index is the cheapest.
Table 7: Fundamentals of the S&P/ASX index series
|
|
S&P/ASX 200 |
S&P/ASX 50 |
S&P/ASX Small Ordinaries |
S&P/ASX MidCap 50 |
|
Return on equity (ROE) % |
13.19 |
14.03 |
7.28 |
11.62 |
|
Long term debt to capital % |
39.36 |
43.64 |
22.09 |
27.13 |
|
Historic 3 year earnings per share growth % |
5.26 |
3.87 |
13.13 |
8.32 |
|
Historic 3 year sales growth % |
5.20 |
2.52 |
21.29 |
6.72 |
|
Dividend Yield (DY) % |
3.33 |
3.65 |
2.04 |
2.36 |
|
Price to Book (P/B) |
2.39 |
2.46 |
2.27 |
2.15 |
|
Price to Sales (P/S) |
2.67 |
2.87 |
2.34 |
1.96 |
|
Weighted average market capitalisation ($m) |
12,283.28 |
34,713.78 |
1,740.11 |
6,583.30 |
While ETFs tracking each index has its merit for portfolio inclusion and you should assess all the risks and consider your investment objectives, the VanEck S&P/ASX MidCap ETF (ASX: MVE) is the only ETF listed on ASX which tracks the S&P/ASX MidCap 50 Index. Through one trade, investors can access a portfolio of 50 stocks and gain instant access to the ‘sweet spot’ of the Australian equity universe. As an ETF, MVE is cost effective, liquid and transparent with holdings published daily.
Past performance is no guarantee of future performance. The above is not a recommendation. Please speak to your financial adviser or stock broker.
For further information, contact us via email or call us on +61 2 8038 3300.
Key risks
An investment in MVE carries risks associated with: financial markets generally, individual company management, industry sectors, stock and sector concentration, fund operations and tracking an index. See the PDS for details. No member of the VanEck group of companies guarantees the repayment of capital, the payment of income, performance, or any particular rate of return from any fund.


Published: 29 October 2021