The tale of two beasts - China and emerging markets
Many investors gain exposure to China via emerging markets portfolios. Is this the best way?
China performance
MSCI China was the third best performing country index out of 28 MSCI classified emerging markets indexes over one year to 31 January 2021 (figure 1). Despite disruptions resulting from COVID-19, China’s economy grew 2.3% in 2020 and it is likely to be the only major economy to have expanded last year. Economic recovery, as represented by China’s Caixin manufacturing & services purchasing managers’ index (PMI), rebounded quickly following Q1 2020 lockdown (figure 2).
Figure 1 – MSCI region & country 1yr performance relative to market cap USD ($tn)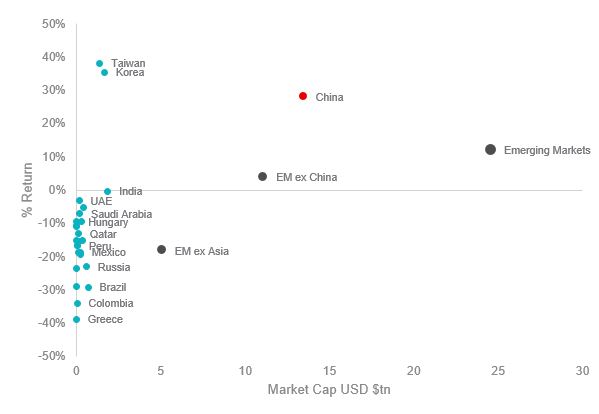
Source: Bloomberg. 31 January 2020 to 31 January 2021. You cannot invest directly in an index. Indexes are all MSCI (Country/Economic area) Indexes.
Figure 2 -China Caixin manufacturing & services purchasing managers’ index (PMI)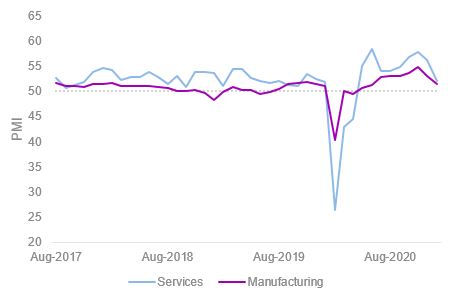
Source: Bloomberg
PMI readings above 50 indicate expansion, while those below that signal contraction.
Emerging markets China allocation
China represents 40% of MSCI Emerging Markets (EM) index and is the leading contributor to MSCI EM positive performance (figure 3). China’s weight in MSCI EM has climbed from 17% in 2014 and could reach 50% if MSCI removed the existing 20% capping on China A-shares exposure (figure 4).
China A-shares are equity shares of China-based companies that trade on the Shanghai and Shenzhen Stock Exchanges. MSCI cap China-A shares exposure due to the limitations in market accessibility. Restrictions include international investors requiring a Renminbi Qualified Foreign Institutional Investor (RQFII) license to trade many of the China-A shares and there are also foreign share ownership caps.
Figure 3 - 1Yr MSCI Region & China performance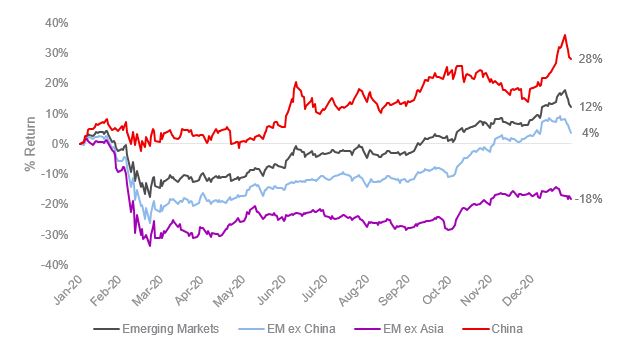
Source: Bloomberg. 31 January 2020 to 31 January 2021. Emerging Markets is MSCI Emerging Markets, EM ex China is MSCI EM ex China Index, EM ex Asia is MSCI EM ex Asia, China is MSCI China. Past performance is not a reliable indicator of future performance.
The stark difference in performance between China and the rest of emerging markets plus the fact that the Chinese equity market will make up almost half of MSCI emerging markets may make investors question how to allocate to the emerging markets universe.
Figure 4 – MSCI EM weight by country
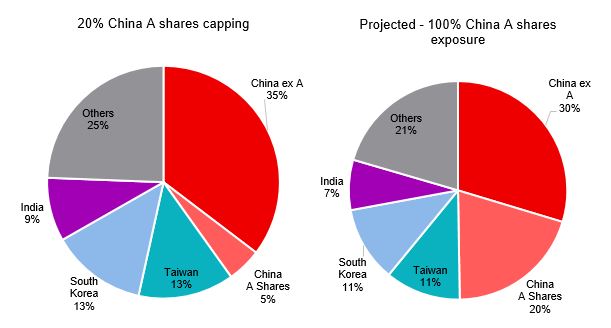
Source: MSCI. As at 31 January 2021
Direct access to China
VanEck offers two dedicated China equity ETFs on ASX: the VanEck Vectors FTSE China A50 ETF (ASX: CETF) and VanEck Vectors China New Economy ETF (ASX: CNEW).
VanEck is one of the few fund managers in Australia that has an RQFII and can trade shares within the local Chinese markets, while also having access to Stock Connect.


Published: 24 February 2021
VanEck Vectors FTSE China A50 ETF (CETF )and VanEck Vectors China New Economy ETF (CNEW) are issued by VanEck Investments Limited ACN 146 596 116 AFSL 416755 (‘VanEck’). This is general advice only, not personal financial advice. It does not take into account any person’s individual objectives, financial situation or needs. Read the PDS and speak with a financial adviser to determine if investing in China is appropriate for your circumstances. The PDS’s for CETF and CNEW are available here. An investment in CETF or CNEW carries risks associated with: China; financial markets generally, individual company management, industry sectors, ASX trading time differences, foreign currency, sector concentration, political, regulatory and tax risks, fund operations, liquidity and tracking an index. See the PDS’s for details. No member of the VanEck group of companies guarantees the repayment of capital, the payment of income, performance, or any particular rate of return from any fund.