Resources revolution
The sharp rebound in raw materials prices, sparked inflationary pressures and the Ukraine/Russia conflict has provided a solid floor for global resources and commodities to rally.
The Australian share market has had a stellar March, returning in excess of 5%. Calendar year to date, the S&P/ASX 200 Accumulation Index is one of the only developed equity markets to experience a positive return (in Australian dollar terms), and has returned 2.44% for the first quarter of 2022, keeping its head above water due to rising commodity prices.
The sharp rebound in raw materials prices, sparked inflationary pressures and the Ukraine/Russia conflict has provided a solid floor for global resources and commodities to rally.
Chart 1: CRB Raw Industrial Commodities Index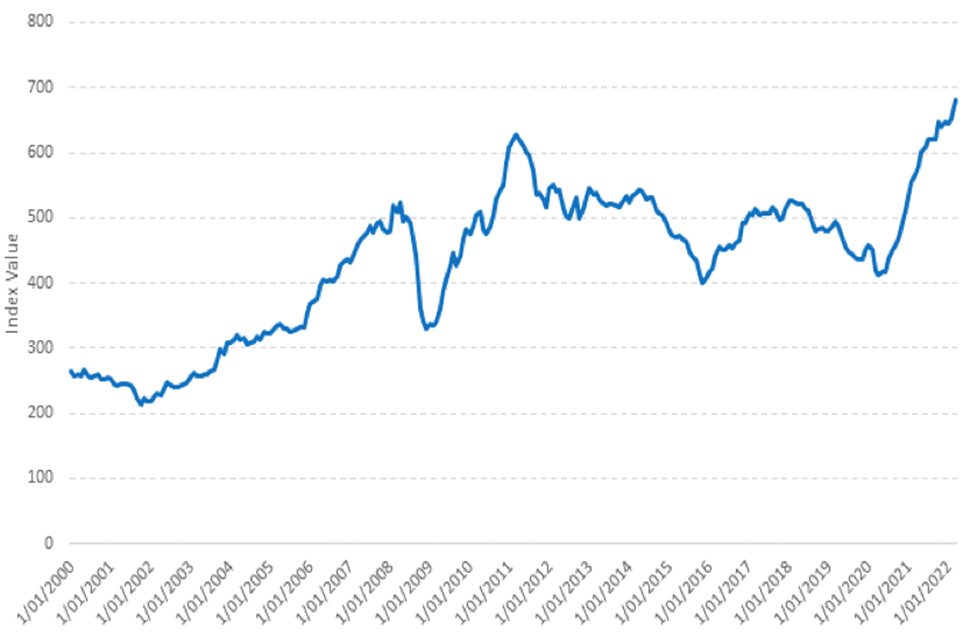
Source: Bloomberg, as at 28 March 2022.
CRB Raw Industrials Spot Price Index (CRB RIND) is a price index constructed from a basket of various industrial commodities including copper scrap, lead scrap, steel scrap, tin, zinc, burlap, cotton, print cloth, wool tops, hides, rosin, rubber, and tallow. You cannot invest directly in an index.
The inflationary environment is suited to commodities. The latest annual December CPI reading of 3.5% in Australia was near a 12-year high and this is positive for resources and energy sectors. Commodities have historically outperformed in periods where there was unanticipated inflation. This outperformance, historically, has also been particularly notable in corresponding periods of positive economic growth.
Chart 2: Average Annual Return in Growth/Surprise Inflation Environments (1970 – 2020)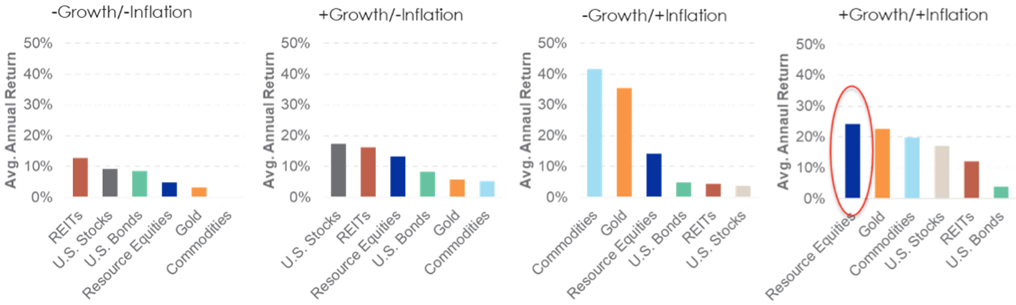
Source: VanEck, CRSP, FactSet, Bloomberg. Data as of December 2021. Past performance is not a guarantee of future results. Commodities is Bloomberg Commodity Index; Gold is Gold spot price in U.S. dollars per troy ounce; Equities is S&P 500 Index; US Bonds is U.S. Generic Government 10-Year Treasury yield; Resources equities is S&P Global Natural Resources Index; REITS is Dow Jones Equity REIT.
The challenge of picking resources stocks
There is no doubt the share prices of Australia’s commodity producers are volatile. Since the beginning of the year, for example, Chalice Mining is down 26.56%, Whitehaven Coal, meanwhile, has risen 74.41%. Disparity of returns exists among resource companies that have similar portfolios, Mineral Resources, which has a sizable iron ore business has fallen 12.12%, while Champion Iron is up 38.45%.
Stock picking is challenging. This is where diversification has its payoff. Since the beginning of 2022, the VanEck Australian Resources ETF (MVR) has returned 16.03%. Some of its stocks have performed poorly but the broad portfolio has easily outperformed the overall share market.
Note: As always, past performance is not a reliable indicator of future performance.
Diversification is key
Compared to other resources ETFs, diversification in MVR is unique because the index it tracks caps individual stocks, reducing the dominance of the mega/large-cap stocks and increasing exposure to mid-caps. In contrast, the market capitalisation Australian resources index, the S&P/ASX 200 Resources Index, is dominated by one mega cap, BHP, which accounts for over 43% of the index, a figure which has ballooned this year after the unification of the BHP London listing into its ASX listing exacerbating concentration risk.
Chart 3: BHP weighting in S&P/ASX 200 Resources Index since 2001
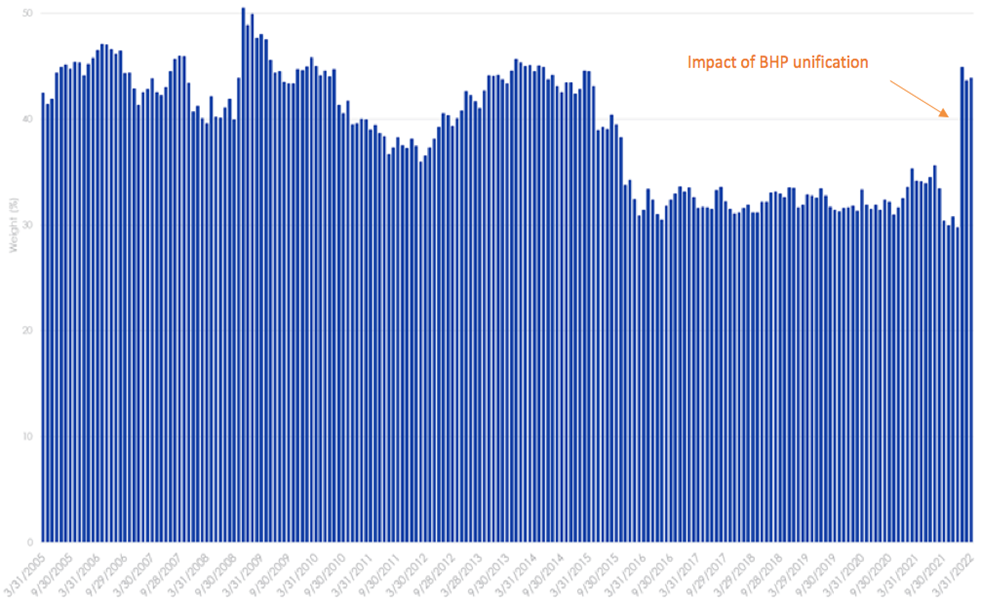
Source: VanEck, FactSet, as of 31 January 2021
What this means is that one stock, BHP, has the potential to drive the performance of the whole resources sector; it is also a company many investors already own. MVR is currently underweight the diversified metals and mining sectors compared to the S&P/ASX 200 Resources Index. Conversely, it is overweight the oil subsectors, gold, coal, copper and aluminium.
MVR is currently underweight the diversified metals and mining sectors compared to the S&P/ASX 200 Resources Index. Conversely, it is overweight the oil subsectors, gold, coal, copper and aluminium.
MVR vs S&P/ASX 200 Resources - Performance
MVR offers investors broad exposure to the resources sector, tracking the performance of the largest and most liquid ASX-listed resources companies. The ETF has outperformed the S&P/ASX 200 Resources Index by 1.28% p.a. since its inception. As always, past performance is not indicative of future performance.
Table 3: Trailing performance to 30 March 2022
|
1 Mth |
3 Mths |
1 yr |
3 yrs |
5 yrs |
7 yrs |
Since Inception* |
|
|
MVR |
9.58 |
15.52 |
28.92 |
13.25 |
16.01 |
14.18 |
10.72 |
|
S&P/ASX 200 Resources |
8.38 |
18.36 |
27.04 |
14.28 |
17.59 |
13.57 |
9.44 |
|
Difference |
+1.20 |
-2.84 |
+1.88 |
-1.03 |
-1.58 |
+0.61 |
+1.28 |
* MVR Inception date is 13 October 2013 a copy of the factsheet is here.
Source: Morningstar Direct, VanEck as at 30 March 2022. The chart and table above show past performance of MVR and of the S&P/ASX 200 Resources Index. You cannot invest directly in an index. Results are calculated to the last business day of the month and assume immediate reinvestment of distributions. MVR results are net of management fees and other costs incurred in the fund, but before brokerage fees and bid/ask spreads incurred when investors buy/sell on the ASX. Returns for periods longer than one year are annualised. Past performance is not a reliable indicator of future performance. The S&P/ASX 200 Resources Index is shown for comparison purposes as it is the widely recognised benchmark used to measure the performance of the resources companies included in the S&P/ASX 200, weighted by market capitalisation. MVR’s index measures the performance of the largest and most liquid ASX-listed companies that generate at least 50% of their revenues or assets from the Australian resources sector, with a maximum weight of 8% in each company at rebalance. Consequently it has fewer companies and different industry allocations than the S&P/ASX 200 Resources Index.


Published: 08 April 2022
VanEck Investments Limited (ACN 146 596 116 AFSL 416755) (VanEck) is the issuer and responsible entity of all VanEck exchange trades funds (Funds) listed on the ASX. This is general advice only and does not take into account any person’s financial objectives, situation or needs. The product disclosure statement (PDS) and the target market determination (TMD) for all Funds are available at vaneck.com.au. You should consider whether or not an investment in any Fund is appropriate for you. Investments in a Fund involve risks associated with financial markets. These risks vary depending on a Fund’s investment objective. Refer to the applicable PDS and TMD for more details on risks. Investment returns and capital are not guaranteed.