Gold momentum stalled by Fed expectations
The momentum that gold had established continued into early September but failed to last as the market prepared for upcoming actions from the Federal Reserve.
Prospect of additional rate hike and balance sheet unwind curb gold in September
The positive momentum gold experienced in August carried over into early September. Geopolitical tension continued as South Korea reacted to possible preparation by North Korea for an intercontinental ballistic missile launch. The US Dollar Index (DXY) fell to new lows (levels not seen since early 2015) when the European Central Bank increased its growth forecast and indicated it would begin discussing a tapering strategy for its quantitative easing policies in October. This drove the gold price to its high for the year at US$1,357 per ounce on 8 September. However, for the remainder of the month, the Federal Reserve (Fed) once again became the primary driver of gold prices, as interest rates and the dollar began to trend higher. After its 19 September Federal Open Market Committee meeting, the Fed announced plans to gradually allow its US$4.5 trillion bond portfolio to runoff. It also forecast one more interest rate hike for 2017. Then, following a 26 September speech, the market became further convinced of a December rate increase when Fed Chair Janet Yellen endorsed continued monetary tightening despite a subdued inflation outlook. As a result gold trended lower, ending the month at US$1,280.15 per ounce for a US$41.25 (3.1%) loss.
Gold companies focusing on positive price trend, capital discipline and growth
Gold stock indices also traded near their highs for the year, but then followed the gold price lower. During September the NYSE Arca Gold Miners Index (GDX Index) retreated 5.74%. There was little concern over September price weakness at the annual gathering of gold companies and institutional investors at the Precious Metals Summit and Denver Gold Forum. Managements from essentially every gold producer and most gold developers attend these events and this year the focus was on the longer-term positive price trend. At the Denver Gold Forum, the majors reiterated their commitment to capital discipline and maintaining low costs. Newmont Mining decided to consider raising its dividend yield to approximately 2% (gold stocks generally carry yields well under 1%). It looks like the industry may be gaining the financial strength to offer yields that outperform gold bullion's 0% yield which may attract more investors.
Reaction to QT another example of market complacency
Since the financial crisis, the stock market has risen consistently so long as the Fed continued to buy treasuries and mortgage-backed securities through its quantitative easing policies (QE 1-3). However, each time the Fed stopped buying bonds (in 2010, 2011, and 2015), the stock market suffered selloffs in the 10% to 15% range. Now the Fed has reversed course with plans to unwind its massive US$4.5 trillion balance sheet (dubbed quantitative tightening or "QT"), yet there are no signs of a market selloff. In fact, the S&P 500 has trended to new all-time highs, NYSE margin debt is at all-time highs, and the CBOE Volatility Index (VIX) hovers around lows last seen in 2007. Perhaps markets don't care about QT because of the small initial runoff of US$10 billion per month and the fact that it has been well telegraphed. However to us, it looks more like this market has a level of complacency rarely seen in history.
A recent New York Times article by Yale Professor of Economics Robert Shiller shows current stock market valuations in a range experienced only in 1929 and between 1997 and 2002. To look for a reason as to why the current high valuations have so far failed to "precipitate those ugly declines in the past", he searches newspaper archives and finds mass psychology to be in a "different, calmer place" today. Widespread fear of a speculative bubble is not evident in the current market. Dr. Shiller is at a loss as to why people are so calm about the markets and suggests maybe investors are distracted by the endless news flow about geopolitics, natural disasters and violence.
Investor complacency doesn't hide the fact that there are financial risks to QT. Forty percent of the Fed's balance sheet unwind is in mortgage-backed securities at the same time that the housing market is showing signs of slowing. The Fed plans to ramp its bond runoff to US$50 billion per month. In her latest comments, Chair Yellen sounds set on raising rates four times through 2018. As the Fed chokes off the juice that fed the feeble post-crisis expansion, it is not hard to imagine complacency turning to fear.
Gold Technical Pattern Supports Positive Long-Term Outlook
We presented this DXY/Gold chart in our December 2016 report. Here we have an updated chart that we find even more compelling.
Fall of U.S. Dollar in 2017 Signals the Start of Next Gold Bull Market?
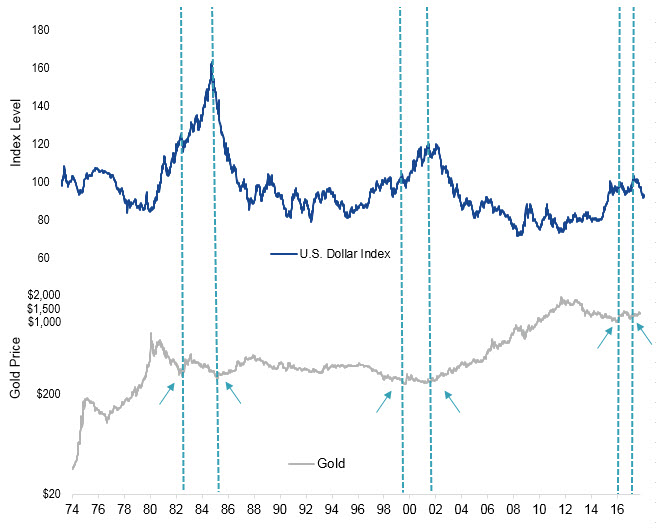
Source: Bloomberg. Data as of September 30, 2017. Not intended to be a forecast of future events, a guarantee of future results or investment advice. Current market conditions may not continue.
Notice the double bottoms gold experienced in 1985 and 2001 that coincided with major tops in the DXY and the beginning of a cyclical gold bull market in 1985 and a secular gold bull market in 2001. The most important new development is the fall in the US
dollar this year, shown on the far right hand of the DXY chart. This looks like the end of a US dollar bull market that ran from 2011 to 2017. It also looks like gold has established a double bottom in December 2015 and December 2016. While the gold price consolidates its August gains and faces the headwinds of
the next Fed rate increase, the long-term technical chart suggests stronger prices for longer are possible. We believe the fundamentals support this technical outlook as the economic expansion ages and significant shifts in central bank policies and geopolitics create risks that drive investors to gold
and gold stocks.
Published: 09 August 2018