Is now the time for Quality?
There has been much coverage about Value’s return as an investment factor since the third quarter last year. But looking ahead, could we see the Quality factor return?
There has been much coverage about Value’s return as an investment factor since the third quarter last year. But looking ahead, could we see the Quality factor return?
The global economic bounce back from COVID-19 recession has been remarkable with the Australian Bureau of Statistics data showing that Australian employment numbers have reached pre-pandemic levels in just 11 months compared to the 1990s recession, which took 49 months.
The pace of recovery surged beyond economists’ expectations with Citigroup’s Economic Surprise Index reaching historic highs in Q3 2020 (chart 1). But it has recently started to normalise.
Chart 1 – G10 Citigroup Economic Surprise Index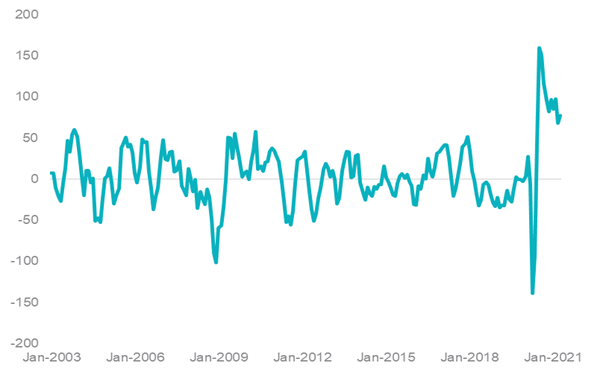
Source: Citigroup, Bloomberg. January 2003 to March 2021.
An optimist’s view of this data would be that data releases have been stronger than expected while a pessimist’s would be that data releases have been worse than expected. We are optimists and we think that economic data has printed higher than most economists’ forecasts.
The normalisation in results then, may be an indication that the global economy is transitioning from an early-cycle to a mid-cycle recovery, which has historically boded well for quality stocks (according to MSCI, a world leading index provider, quality stocks are those with: high return on equity (ROE), stable year-on-year earnings growth and low financial leverage). An early-cycle to a mid-cycle recovery is usually characterised by falling PMIs (Purchasing Managers' Index).
Expansion in economic activity is at the highest level since 1997, represented by the US Institute of Supply Management (ISM) Manufacturing PMI Index (chart 2). The PMI measures the change in production levels across the US economy from month-to-month. It is considered to be a key indicator of the state of the US economy.
Chart 2 – US ISM Manufacturing PMI Index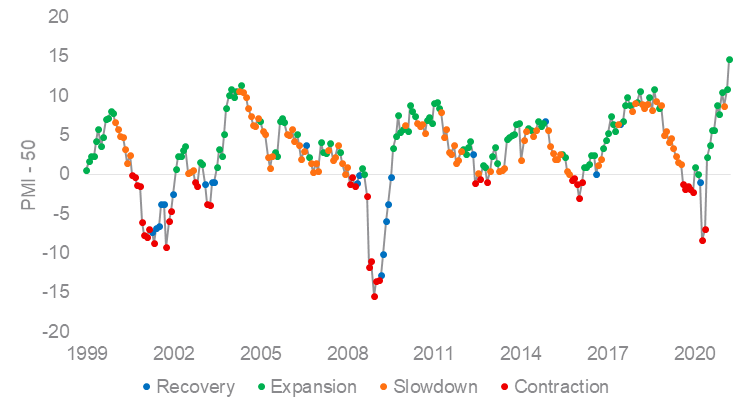
Source: Bloomberg, November 1997 to March 2021. Economic phase is a function on the current value of PMI-50 and the three-month change in PMI. Change>0, Level<0 = Recovery. Change>0, Level>0 = Expansion. Change<0, Level>0 = Slowdown. Change<0,Level<0 = Contraction.
Now if we compare the information ratios of different MSCI World Factors during different economic phases highlighted above it shows that those stocks that exhibit the MSCI Quality Factor historically outperform during slowdown “mid-cycle recovery” and contraction “recession” periods. The information ratio (IR) is a measurement of portfolio returns beyond the returns of a benchmark (i.e MSCI World) relative to volatility of those returns. Positive values indicates risk-adjusted outperformance.
Chart 3 – Information ratio by MSCI World Factor and economic phase
|
Phase |
Quality |
Momentum |
Growth |
Enhanced Value |
|
Recovery |
0.15 |
0.01 |
0.01 |
0.35 |
|
Expansion |
-0.12 |
0.20 |
0.12 |
0.19 |
|
Slowdown |
0.25 |
0.22 |
0.01 |
0.03 |
|
Contraction |
0.39 |
-0.15 |
0.00 |
-0.01 |
Source: Bloomberg, Vaneck. MSCI World Factor indices. November 1997 to March 2021.
Should PMIs print lower than their current levels, which would indicate a slowdown or contraction, Quality could shine.


Published: 29 April 2021
Important notice:
VanEck Investments Limited ACN 146 596 116 AFSL 416755 (‘VanEck’) is the responsible entity and issuer of units in the VanEck Vectors ETF's. This is general advice only, not personal financial advice. It does not take into account any person’s individual objectives, financial situation or needs. Read the PDS and speak with a financial adviser to determine if the fund is appropriate for your circumstances. The PDS is available here. This is general advice only, not personal financial advice. Read the PDS and speak with a financial adviser to determine if a fund is appropriate for your circumstances. The PDS is available at www.vaneck.com.au.
An investment in QUAL has risks, including possible loss of capital invested. QUAL carry risks associated with: financial markets generally, individual company management, industry sectors, ASX trading time differences, foreign currency, country or sector concentration, political, regulatory and tax risks, fund operations and tracking an index. See the PDS for details. No member of the VanEck group guarantees the repayment of capital, the payment of income, performance, or any particular rate of return from either fund.
Related Insights