Most investors have exposure to the FAANGM stocks however recent volatility has highlighted investor’s apprehensions about overpaying for their technology exposure. One way to diversify is to look beyond the mega cap tech stocks and consider the investment opportunity pertaining to video gaming and eSports.
Most investors have exposure to the FAANGM stocks however recent volatility has highlighted investor’s apprehensions about overpaying for their technology exposure.
One way to diversify is to look beyond the mega cap tech stocks and consider the investment opportunity pertaining to video gaming and eSports.
Long-term structural trends favour the growth of video gaming and e-sports companies, as players and spectators flock to digital games. Global pandemic lockdowns too have supported crowds and the growth profile of listed game developers and console producers.
The industry’s growth has been phenomenal. Since 2015, video game revenues have grown at an annualised rate of 13%. By 2023, video game revenues could hit US$200 billion1.
Long-term growth story
The spike in video gaming during the COVID-19 pandemic entrenches a trend underway for several years. Electronic sports and video game engagement metrics have been setting records across several platforms, including broadcast TV, online viewership of gaming and player numbers.
There are 2.7 billion gamers globally2, which is more than Facebook users, Apple devices and Netflix subscribers. But most people are under exposed to this sector. eSports and video games makes up only 4.85% of the NASDAQ 100 and only 3.71% of MSCI’s Information Technology sector.
Figure 1: Exposure to video gaming and eSports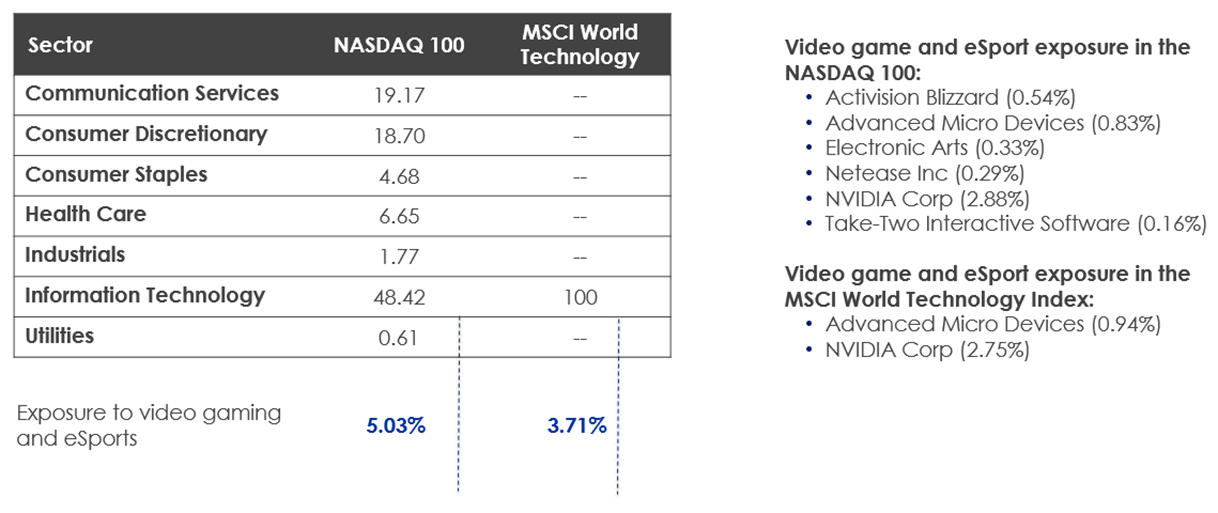
Source: FactSet, as at 30 September 2020. Weightings represent weighting in respective comparable indices.
This makes the video gaming sector an attractive diversifier to the FAANG giants, Facebook, Amazon, Apple, Netflix and Google owner, Alphabet. While FAANGs have powered the returns of the S&P 500 and NASDAQ in recent years, their volatility in September has stoked fears that their momentum could falter.
However, we believe the uptick in video gaming and eSports in the wake of COVID-19 shows no signs of slowing.
Video game companies have been benefiting from unprecedented growth for a number of years. Based on back-testing after fees, the video game sector, as represented by the MVIS Global Video Gaming & eSports Index (ESPO Index net of management cost) outpaced the broader global equity market and the tech-heavy NASDAQ 100 index over the past five years.
Figure 2: Cumulative index returns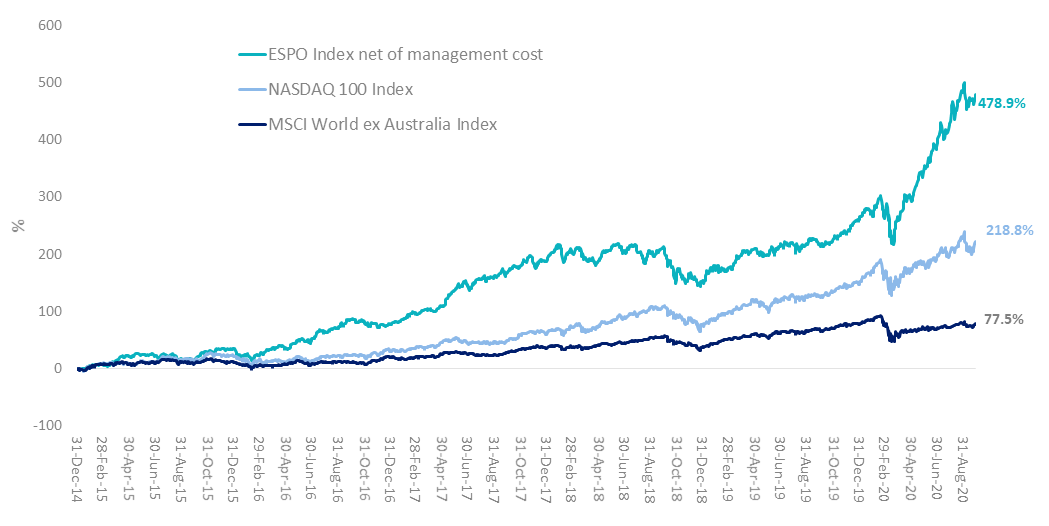
Source: Bloomberg, Morningstar Direct, VanEck as at 29 September 2020. The above graph is a hypothetical comparison of performance of the ESPO Index net of ESPO’s 0.55% p.a. management fee, and the NASDAQ 100 and MSCI World ex Australia Index from the base date of ESPO Index which is 31 December 2014. ESPO Index performance prior to its launch on 14 August 2020 is simulated based on the current index methodology. Past performance is not a reliable indicator of future performance. You cannot invest directly in an index. Returns in ESPO’s Index are calculated daily and assume immediate reinvestment of dividends, and are net of ESPO’s management fees but do not include brokerage costs or buy/sell spreads of investing in ESPO.
VanEck Vectors Video Gaming and eSports ETF (ASX: ESPO)
ESPO is an Australian first. It offers investors the unique opportunity to invest in the largest pure-play video gaming and eSports companies in the world. ESPO tracks the MVIS Global Video Gaming & eSports Index which includes companies which generate at least 50% of their revenues from video gaming and/or eSports.
When compared against the NASDAQ 100, ESPO exhibits favourable historical Earnings per Share (EPS) and Sales Growth as well as notably cheaper valuations. The fund’s Price/Earnings (P/E) ratio of about 31 times which is lower than the NASDAQ’s 38 times. It also has a lower Price to Book (P/B).
|
Fundamentals |
NASDAQ 100 |
ESPO |
|
3Yr EPS Growth (%) |
33.7 |
33.0 |
|
3Yr Sales Growth (%) |
17.7 |
28.9 |
|
Price to Earnings (P/E) (x) |
36.3 |
31.3 |
|
Price to Book (P/B) (x) |
7.80 |
5.94 |
|
Price to Sales (P/S) (x) |
5.20 |
6.53 |
|
Market Capitalisation (A$m) |
1,092,388 |
144,047 |
Source: FactSet, as at 29 September 2020
Find out more about investing in ESPO.
1. Newzoo. Projected revenues for 2018-2023.
2. The World’s 2.7 Billion Gamers Will Spend $159.3 Billion on Games in 2020; The Market Will Surpass $200 Billion by 2023, T. Wijman 8 May 2020 via newzoo.com
Find out
>

Published: 05 October 2020
Issued by VanEck Investments Limited ACN 146 596 116 AFSL 416755 (‘VanEck’). This is general advice only, not personal financial advice. It does not take into account any person’s individual objectives, financial situation or needs. Read the PDS and speak with a financial adviser to determine if the fund is appropriate for your circumstances. The PDS is available here [LINK to https://www.vaneck.com.au/library/regulatory-documents/], and details the key risks. No member of the VanEck group of companies guarantees the repayment of capital, the payment of income, performance, or any particular rate of return from the fund.
An investment in ESPO carries risks associated with: financial markets generally, individual company management, industry sectors, ASX trading time differences, foreign currency, country or sector concentration, political, regulatory and tax risks, fund operations and tracking an index. See the PDS for details.
MVIS Global Video Gaming and eSports Index (AUD) (‘MVIS Index’) is the exclusive property of MV Index Solutions GmbH based in Frankfurt, Germany (‘MVIS’). MVIS is a related entity of VanEck. MVIS makes no representation regarding the advisability of investing in the Fund. MVIS has contracted with Solactive AG to maintain and calculate the MVIS Index. Solactive uses its best efforts to ensure that the MVIS Index is calculated correctly. Irrespective of its obligations towards MVIS, Solactive has no obligation to point out errors in the MVIS Index to third parties.
Related Insights