The dragon is still roaring
Earlier this month we held our first China Investor Symposium. Gerard Minack’s views on China stood out and his slides on China’s historical earnings and earnings per share (EPS) were thought provoking. As presented, the data may make investors consider their allocation to China equities.
However, the data was for the MSCI China Index. It’s important to consider beyond this.
VanEck held its inaugural China Investor Symposium earlier this month. China's equity paradox was highlighted by Gerard Minack. The China equity paradox is the lacklustre equity returns when compared to the stellar GDP growth of the Chinese economy.
China’s investment challenges
According to Gerard, it is not earnings growth that drives share market performance, but earnings per share (EPS) growth. While earnings have been impressive, China’s share market EPS growth has been negative over the past 14 years.Chart 1: Annual average earnings and EPS growth from 1996
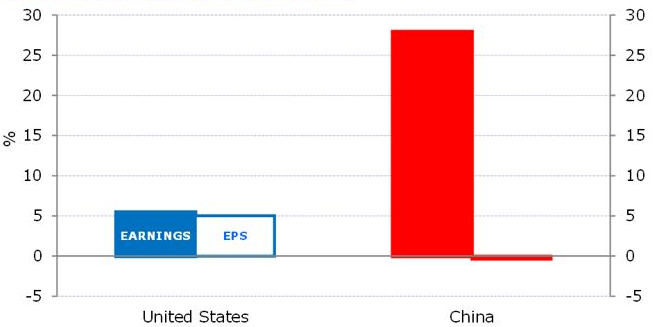
Sources: MSCI, Standard and Poor’s, Minack Advisers. Indices used: Unites States: S&P 500; China: MSCI China Index (left bar – earnings, right bar – EPS). 1996 – 2020
China’s massive growth has not fed through to EPS. Gerard puts this down to dilution, which is common in growing markets and this has been reflected in China equity performance. However Gerard’s data only considers the performance of the MSCI China Index. When you consider the performance of the CSI MarketGrader China New Economy Index, it has far outstripped its broad market peer.
Figure 2: CSI MarketGrader China New Economy Index1, adjusted for VanEck Vectors China New Economy ETF's management costs, cumulative performance versus MSCI China Index to 31 January 2020
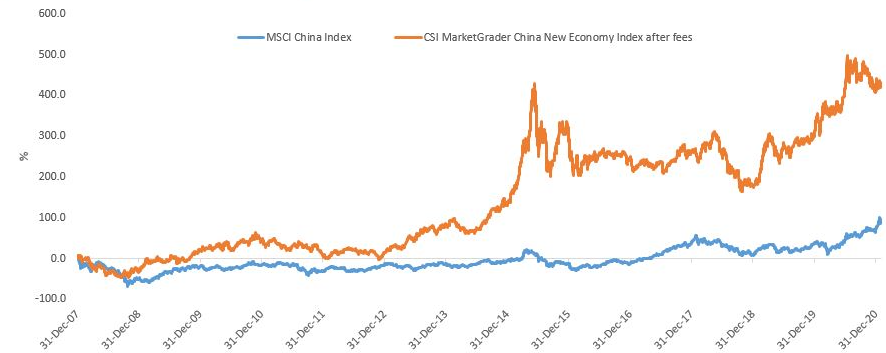
1 - CSI MarketGrader China New Economy Index results are net of VanEck Vectors China New Economy ETF’s (CNEW) 0.95% p.a. management costs, calculated daily but do not include brokerage costs or buy/sell spreads of investing in CNEW. You cannot invest in an index. CSI MarketGrader China New Economy Index base date is 31 December 2007. For up to date past performance information, click here.
Source: Bloomberg, Morningstar Direct, VanEck as at 31 January 2021. Returns are calculated daily and assume immediate reinvestment of dividends. Past performance is not a reliable indicator of future performance. The MSCI China Index is used to measure the performance of approximately 650 large- and mid-cap companies across China A shares, H shares, B shares, Red chips, P chips and foreign listings (e.g. ADRs) weighted by market capitalisation. The CSI MarketGrader China New Economy Index measures the performance of 120 China A-shares with the best growth at a reasonable price (GARP) attributes at rebalance. The CSI MarketGrader China New Economy Index has fewer companies and sectors and different allocations than MSCI China Index. Click here for more details.
It turns out too, the EPS growth of China’s New Economy is very different from MSCI China Index.
EPS growth in the China New Economy
MarketGrader analysed the historical earnings and EPS growth for the CSI MarketGrader China New Economy Index.
Chart 3: EPS Growth and total earnings growth of the CSI MarketGrader China New Economy Index
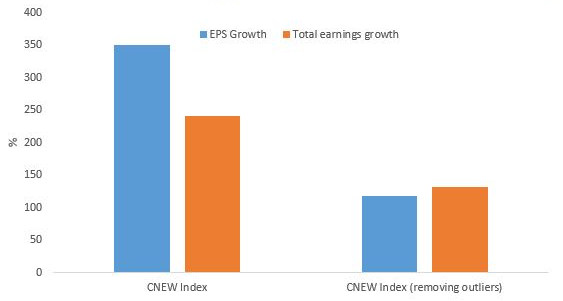
Source: MarketGrader, Factset. 31 December 2007 to 31 December 2020 You cannot invest in an index.
This is so different from MSCI China Index it warrants an explanation of what MarketGrader did to calculate this: They took the EPS 1-year growth rate of all companies in the CSI MarketGrader China New Economy Index since its base date in December 2007 and calculated all of their historical averages to date. It is worth noting: since companies are often included in the CSI MarketGrader China New Economy Index for more than one six-month period in a year, MarketGrader counted those growth rates twice. For example, if a company was eligible for inclusion in the index last December, we counted the 1-year EPS growth rate for the 12 months ended in September 2020 and if the same company was also eligible in June 2020, they also included the 1-year growth rate for the 12 months ended in March 2020.
You can see based on the above, the average 1-year EPS growth rate of all CSI MarketGrader China New Economy Index constituents since inception was 350%. When MarketGrader removed a handful of outliers with growth rates exceeding 10,000%, the average is 118%.
Then MarketGrader went one step further. It took the trailing 12-month net income for all CSI MarketGrader China New Economy Index constituents since inception for the period ended in the quarter preceding their selection to the CSI MarketGrader China New Economy Index; here the same rules described above applied for companies selected more than once in a year to the index. MarketGrader calculated the 1-year growth rate for each of those figures relative to the net income for the 12 months ended a year earlier. They then averaged all the annual growth figures, which essentially represents total earnings growth, as opposed to EPS. The result was an average annual growth rate in total earnings of 241%; when the outliers are removed the average is 131%.
As you can see, the EPS growth numbers are above the earnings growth numbers. So unlike the many constituents of MSCI China Index, the constituents of CSI MarketGrader China New Economy Index experienced earnings growth which outpaced the rate at which they issued new shares, translating into shareholder gains. This is evident in the cumulative total return in figure 2.
It also underscores the point: security selection matters when you're trying to harness the underlying economic growth of China's economy.
Related Insights


Published: 16 February 2021
CNEW tracks the CSI MarketGrader China New Economy Index. "MarketGrader" And “CSI MarketGrader China New Economy Index” are trademarks of MarketGrader.com Corporation. MarketGrader does not sponsor, endorse, sell or promote the Fund and makes no representation regarding the advisability of investing in the Fund. The inclusion of a particular security in the Index does not reflect in any way an opinion of MarketGrader or its affiliates with respect to the investment merits of such security.