Finding the best yield
‘Yield’ is calculated and quoted in many ways, and this can be confusing. Here we explain.
Bonds are funny things and even though most people are invested in them via their superannuation or pension fund, very few people understand them.
We want to help, highlighting a key reason for investing in bonds: Yield. Let’s go yield hunting.
A bond is essentially a loan by an investor to the entity issuing the bond. The entity could be the Commonwealth Government of Australia, the State Government of New South Wales or a company like ANZ or Wesfarmers.
In return for the loan, the entity makes a promise, that is, it “gives its bond”, that it will repay the loan on a specified date (the maturity date) and it will make interest payments at regular intervals during the term of the loan.
Bonds are issued at a particular face value or principal, with a specified interest rate, called the coupon rate. Like a term deposit, the longer the term of the bond, generally the higher the coupon rate on the investment; investors are rewarded for locking up their money for longer.
The coupon rate also varies depending on the borrower, and the confidence that the lender has that the borrower will fulfil their repayment commitment. The creditworthiness of the borrower is considered by the lender.
You are likely to be more confident that you will be repaid by the Australian government than say a business looking to secure short-term funding. As a result, the coupon will be lower for an Australian government bond than for a corporate bond.
Investors use assets like bonds in their portfolios to enhance income and complement low-risk interest-paying investments such as cash and term deposits. In the same way that investors diversify their equity portfolio by investing in many companies across many sectors and geographies, a well-diversified bond portfolio should also include many types of issuers, different sectors and different geographies.
As income is a key reason for buying bonds, it is useful to understand this ‘income’.
Coupons
Similar to a loan, a bond is issued for a specific term or maturity. This generally ranges from 12 months to 30 years. Most bonds have a fixed coupon which is paid periodically to investors (often monthly or quarterly) from the time the bond is issued through to its maturity.
As an example, a bond might be issued with a face value of $100 and a 7% fixed coupon and a term to maturity of 2 years. This means the bond will pay investors a $7 coupon each year over the life of the bond. At the maturity date, the issuer has an obligation to repay the $100 principal plus the final $7 coupon to the bond holder.
A bond’s coupon reflects:
- The bond’s term to maturity
- Prevailing market interest rates at the time the bond is issued; and
- The issuer’s creditworthiness.
Coupon on floating rate bonds
Some corporate bonds pay a floating coupon rate, which can vary over the bond’s term. The coupon is typically calculated as a set margin above a recognised short-term market interest rate. For example, the coupon rate on floating rate notes (FRNs) is often stated as “the 3-month bank bill swap rate + 1%” or “3mth BBSW + 1%”. FRN coupon rates are typically reset every 3 months based on the prevailing market interest rate. This means coupon payments will increase if market interest rates rise, or fall if rates go down.
Yield measures
The coupon is different from the bond’s ‘yield’. There are various ways to calculate ‘yield’ and this can be very confusing. There are two commonly used yield measures, yield to maturity and running yield.
|
Yield to maturity Yield to maturity is the rate of return earned by an investor who buys the bond today at the market price. This measure assumes the investor will hold the bond until maturity and receives all the coupons payments and the principal repayment on schedule. Running yield The running yield is a calculation that divides the annual income expected to be received by the investor by the bond’s current market value. The running yield will be higher than the yield to maturity if the market value of the bond is higher than its original face value and vice versa. |
|
|
Yield to call You may also see the term yield to call, which is similar to yield to maturity. Yield to call is the industry standard for comparing yields for hybrid-type securities like subordinated debt, ASX listed hybrids and capital securities. These bonds are ‘callable’ bonds, which means the bond issuer can ‘call’ them prior to maturity. Yield to call refers to the return an investor receives if the bond is held until its earliest call date. |
|
Comparison of yield to maturity and running yield
The example below shows the different results of the two measures:
A bond has an annual coupon rate of 7% ($7).
The bond has a face value of $100 and has one month to go until maturity. Only the final coupon and principal payment remain to be made.
The market value of the bond is currently $106.90. This is marginally less than the face value of $100 plus the final coupon payment ($7).
|
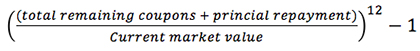
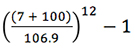
Yield to maturity equals |
 |
|
 |
||
| 1.13% | ||
|
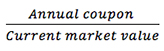
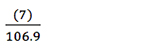
Running yield equals |
 |
|
 |
||
| 6.55% |
In this example, the running yield is not a fair representation of the anticipated return on a bond investment. Investors should instead use the yield to maturity that represents the actual return earned.
When it comes to running yield comparisons, we would always recommend caution. The measure itself is not widely used by institutional fixed income practitioners, as it can be misleading because it does not show the full picture. The measure only reflects the income and not the capital gain/loss at maturity, which depends on the price paid for the bond.
The yield of an ETF
A convenient way diversify your investment in bonds is via an exchange traded fund (ETF). ETFs are managed funds that trade on the ASX just like shares, so some of the jargon used in share investing applies to ETFs. ETF investors may also be interested in the ‘dividend yield’ of their ETF.
A dividend yield measures the historical cash flow paid by an ETF based on the current price of the ETF. The dividend yield is calculated by adding up the distributions paid in the past twelve months and dividing it by the current net asset value (NAV) of the ETF.
Good yield hunting – diversification
Below are the current yield metrics for VanEck’s bond ETFs. You can see some have only one issuer, while others have many, this is why it is also important to have a range of ETFs in your bond portfolio, as noted above it is important to be well diversified by issuer, sector and geographies. In the table below Investment Grade refers to those bonds which have a credit rating of BBB- or higher.
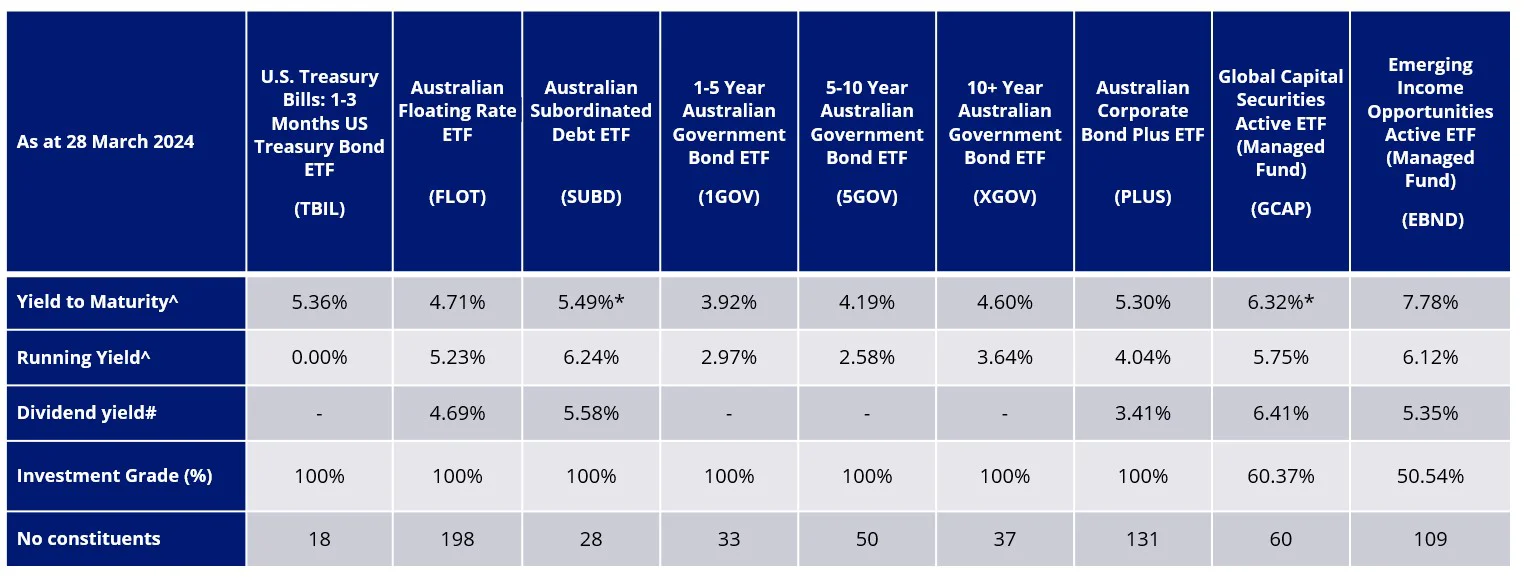
*yield to worst; ^yield measures are not a guarantee of future dividend income from the funds.
# ETF’s without 12 months of dividends do not have a 12-month dividend yield. The dividend payment history of all funds identified above is not a guarantee of future dividends payable from those funds. Past performance is not indicative of future results.
For the braver yield hunters
You may have read about private credit. Australia’s largest investors, including our biggest superannuation funds, are investing in this asset class. Private credit companies issue loans to small and middle-sized non-public companies and as you can imagine, these tend to be at higher rates than banks would charge. This means that these types of loans are riskier, therefore you would expect the yield to be higher.
Earlier this year we launched the VanEck Global Listed Private Credit (AUD Hedged) ETF (LEND), which is a way for ASX investors to access this asset class that to date has generally been limited to high net worth and the big end of town who don’t require immediate access to cash and can take concentrated positions. Our website currently quotes the dividend yield of the LEND portfolio as 10.02% (Dividend Yield is the weighted average of each portfolio security’s distributed income during the prior twelve months).
For the active yield hunters
A ‘yield’ curve is a line that plots the yields of Australian Government Bonds with differing maturity dates. The slope of the yield curve can predict economic activity and future interest rate changes.
For our active hunters, this Vector Insights explains to investors how to manage the yield curve.
Happy yield hunting…
An investment in any of the funds mentioned carries risks. See the PDS and TMD for more details.

Last Updated On: 17 April 2024
Any views expressed are opinions of the author at the time of writing and is not a recommendation to act.
VanEck Investments Limited (ACN 146 596 116 AFSL 416755) (VanEck) is the issuer and responsible entity of all VanEck exchange trades funds (Funds) listed on the ASX. This is general advice only and does not take into account any person’s financial objectives, situation or needs. The product disclosure statement (PDS) and the target market determination (TMD) for all Funds are available at vaneck.com.au. You should consider whether or not an investment in any Fund is appropriate for you. Investments in a Fund involve risks associated with financial markets. These risks vary depending on a Fund’s investment objective. Refer to the applicable PDS and TMD for more details on risks. Investment returns and capital are not guaranteed.