In-flight announcement: Don’t forget your ‘quality’ life jacket
While central banks are doing all they can to combat inflation, they are also wary of a ‘hard landing’, that is when an economy enters recession after an interest rate hiking cycle. Historically, it has been the most common scenario, 75 percent of US monetary policy tightening cycles since 1955 have resulted in a recession.
Should a hard landing eventuate, quality is the ‘go-to’ factor during a slowdown and the corresponding recovery.
When risks in markets are pronounced, investors choose quality rather than non-quality assets to withstand the turbulence, in what has become known as the ‘flight to quality’. For good reason as well, during slowdowns and recoveries of the past quality international companies have lost less and recovered faster.
Global markets have capitulated since the NASDAQ 100, proxy for US growth and tech stock performance, reached an all-time high in November 2021.The falls are the result of two key drivers: high inflation and the corresponding higher interest rate expectations. As a result valuations have been downgraded and ‘growth’ companies have been hit hardest.
While central banks are doing all they can to combat inflation, they are also wary of a ‘hard landing’, that is when an economy enters recession after an interest rate hiking cycle. Savvy investors are sifting through the current ‘bear’ market, preparing to navigate the global macroeconomic environment. Should a hard landing eventuate, quality is the ‘go-to’ factor during a slowdown and the corresponding recovery. Quality's defensive characteristics are reinforced during these periods.
Hard landing definition
A ‘hard landing’ refers to a period where the economy enters a recession following a series of central bank cash rate increases. Historically, it has been the most common scenario, 75 percent of US monetary policy tightening cycles since 1955 have resulted in a recession. It is understandable why many investors see this as the base scenario for this cycle, a recession followed the last five instances when US inflation peaked above 5 percent; 1970, 1974, 1980, 1990 and 2008. The US inflation print for June 2022 was 9.1 percent.
Figure 1: US Federal Fund effective rate versus recession periods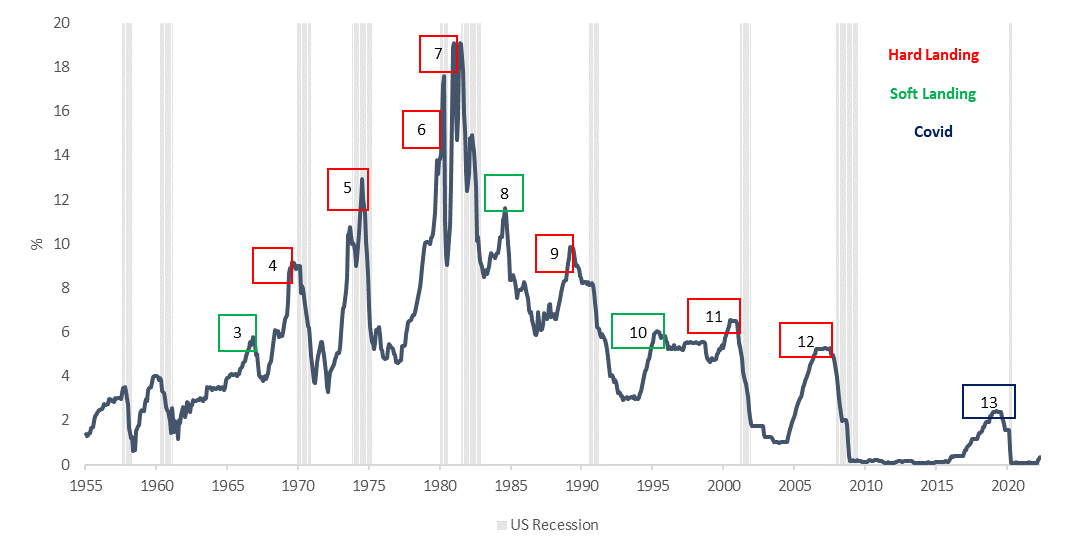
Source: Board of Governors of the Federal Reserve System (US)
The ‘flight to quality’
Some investors have used the phrase a ‘flight to quality’. What it means is that when risks in markets are pronounced, investors choose quality versus non-quality assets to ride the storm. To illustrate how quality companies have performed, we use the MSCI World ex Australia Quality Index (Quality Index), which has been calculated by MSCI back to 1994, capturing the recessions in 2000, 2008-2009 and the most recent COVID downturn. Each of these recessions resulted in, or followed stock market falls.
Historically quality companies have lost less and recovered faster in risky periods associated with market falls. In the table below, we have highlighted the dot-com bubble, GFC and the COVID-19 market meltdown. In all these episodes, quality international companies lost less and recovered faster. The table below compares the drawdowns of the MSCI World ex Australia Quality Index, versus the market benchmark.
Table 1: Significant drawdowns events, 2000 to 2022
|
|
Quality Index (Maximum Drawdown) |
Benchmark (Maximum Drawdown) |
Relative recovery rate of Quality Index |
|
March 2000 – Dot-com bubble |
-45.02% |
-48.74% |
10 months faster |
|
October 2007 – Stock market sell off |
-21.95% |
-34.93% |
9 months faster |
|
August 2008 - Lehman Brothers file for bankruptcy |
-14.76% |
-24.73% |
16 months faster |
|
February 2020 – COVID19* |
-19.62% |
-23.71% |
8 months faster |
Source: MSCI, VanEck, Morningstar Direct. Comparison of drawdown between the MSCI World ex Australia Quality Index (‘Quality Index’) versus the MSCI World ex Australia Index (‘Benchmark’). Maximum drawdown is the peak to trough decline from the start of the month specified to the recovery date, expressed as a percentage. The rate of recovery is the number of periods taken to recover from the trough to peak incline. The calculations for the above include the reinvestment of all dividends but do not include fees and other costs associated with an investment in QUAL. You cannot invest in an index. Past performance is not a reliable indicator of future performance of the index or QUAL.
Right now, markets are experiencing a ‘bear market’, which has the generally accepted description of a market fall greater than 20%.
This is the 27th bear market in the S&P 500 since 1928. The average length of the past bear markets was 289 days (9.5 months), with an average decline of about 36%. The longest was in 1973-74, which lasted 630 days.
Now if we compare these to bull markets of which there has been 26 since 1928. Bull markets tend to be longer, averaging 991 days (33 months). The average rise of the share market during a bull market is 114% and the longest was almost 11 years, from 2009 until the COVID-19 crisis.
It’s little wonder then why savvy investors are looking for opportunities, understanding they may not pick the bottom, but they were not going to pick the top either.
If the global economic recovery falters and we enter a recession, it could benefit quality companies, as they tend to offer investors relative protection during weaker economic environments and heightened market volatility.
Figure 2 illustrates how quality companies typically outperform when manufacturing activity (a proxy for economic activity) decelerates (orange) and/or contracts (red).
Figure 2: US ISM Manufacturing PMI Index and MSCI World Quality versus MSCI World performance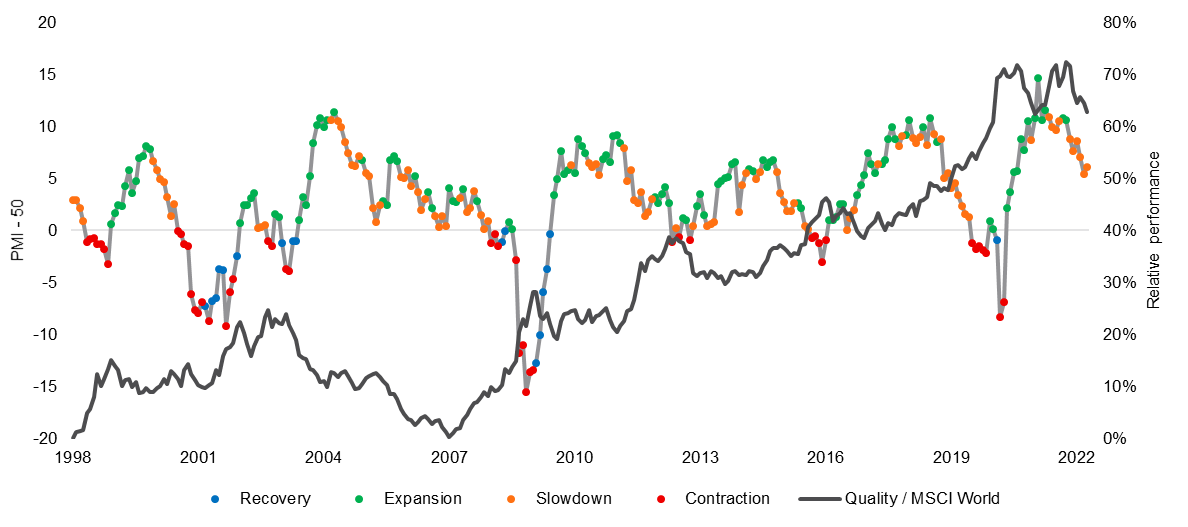
Table 2: Factor performance during different economic regimes
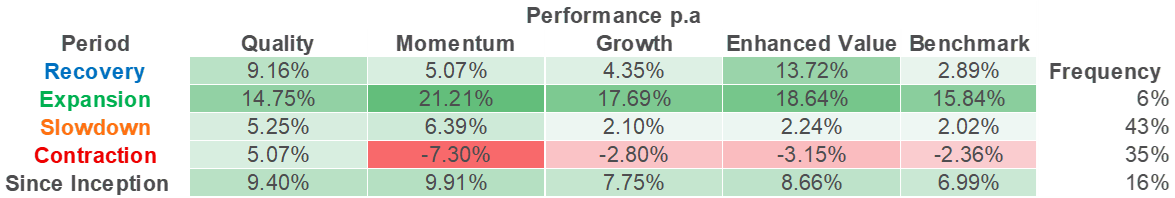
Figure 2 and table 2 source: Bloomberg. MSCI. Past performance is not a reliable indicator of future performance.
QUAL has delivered long-term outperformance
The VanEck MSCI International Quality ETF (ASX: QUAL) tracks the Quality Index and provides investors with an international equity portfolio of 300 companies with fundamentals that satisfy principles of quality investing advocated by investment greats Benjamin Graham and Warren Buffett, namely:
i. High ROE;
ii. Stable year-on-year earnings growth; and
iii. Low financial leverage.which is a smart beta approach that provides investors the best of both active and passive worlds:
Since its inception on 29 October 2014, QUAL has returned 13.73% p.a., outstripping the standard industry benchmark, the MSCI World ex Australia Index, by 2.48% p.a. As always past performance is not a reliable indicator of future performance.
Table 3: QUAL Performance to 30 June 2022
|
1 Year (%) |
3 Years |
5 Years |
7 Years |
Since QUAL Inception (% p.a.) |
|
|
QUAL |
-8.75 |
10.36 |
13.11 |
12.01 |
13.73 |
|
MSCI World ex Australia Index |
-6.52 |
7.82 |
10.12 |
9.31 |
11.25 |
|
Difference |
-2.23 |
+2.54 |
+2.99 |
+2.70 |
+2.48 |
*Inception date is 29 October 2014
Source: Morningstar Direct, VanEck. The chart above shows past performance of QUAL and of the MSCI World ex Australia Index. You cannot invest directly in an index. Results are calculated to the last business day of the month and assume immediate reinvestment of distributions. QUAL results are net of management fees and other costs incurred in the fund, but before brokerage fees and bid/ask spreads incurred when investors buy/sell on the ASX. Returns for periods longer than one year are annualised. Past performance is not a reliable indicator of future performance. The MSCI World ex Australia Index (“MSCI World ex Aus”) is shown for comparison purposes as it is the widely recognised benchmark used to measure the performance of developed market large- and mid-cap companies, weighted by market capitalisation. QUAL’s index measures the performance of 300 companies selected from MSCI World ex Aus based on MSCI quality scores, weighted by market cap x quality score at rebalance. Consequently QUAL’s index has fewer companies and different country and industry allocations than MSCI World ex Aus.
Key risks
An investment in the QUAL and QHAL carries risks associated with ASX trading time differences, financial markets generally, individual company management, industry sectors, foreign currency, currency hedging, country or sector concentration, political, regulatory and tax risks, fund operations and tracking an index. See the PDS for details.


Published: 20 July 2022
Any views expressed are opinions of the author at the time of writing and is not a recommendation to act.
VanEck Investments Limited (ACN 146 596 116 AFSL 416755) (VanEck) is the issuer and responsible entity of all VanEck exchange trades funds (Funds) listed on the ASX. This is general advice only and does not take into account any person’s financial objectives, situation or needs. The product disclosure statement (PDS) and the target market determination (TMD) for all Funds are available at vaneck.com.au. You should consider whether or not an investment in any Fund is appropriate for you. Investments in a Fund involve risks associated with financial markets. These risks vary depending on a Fund’s investment objective. Refer to the applicable PDS and TMD for more details on risks. Investment returns and capital are not guaranteed.
QUAL is indexed to a MSCI index. QUAL is not sponsored, endorsed or promoted by MSCI, and MSCI bears no liability with respect to QUAL or the MSCI Index. The PDS contains a more detailed description of the limited relationship MSCI has with VanEck and QUAL.