The revenge of value investing
Buying ‘value’ companies, the go to active manager investment strategy prior to the global financial crisis could once again be the dominant factor for generating outperformance over the medium term as ‘sticky’ inflation persists.
Buying ‘value’ companies, the go to active manager investment strategy prior to the global financial crisis could once again be the dominant factor for generating outperformance over the medium term as ‘sticky’ inflation persists.
Value investing is simply buying cheap companies with the hope that the share price will reach its intrinsic value in the near term, outperforming the benchmark.
Chart 1: Cumulative relative performance of MSCI World Value versus MSCI World Growth
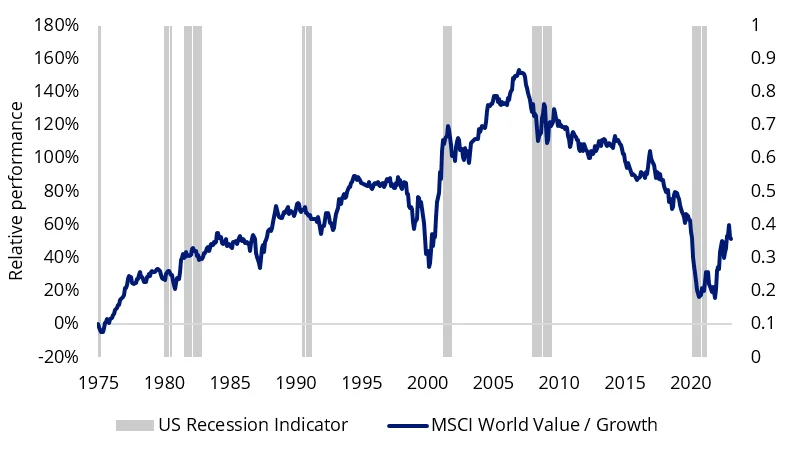
Source: Bloomberg, MSCI. Past performance is not indicative of future results. You cannot invest directly in an index.
The latest data points in the US highlight the resilience of the labour market despite rapid increases in the Fed Funds rate. The unemployment rate dropped to 3.4% in January unexpectedly, the lowest since May 1969 despite trending up late last year and headline CPI YoY printed higher than expected at 6.4% with US services inflation continuing to accelerate. The Fed knows secretly that significant labour retrenchment is required to break services inflation which contributes more than 60% to total CPI and is a function of record low unemployment and high wage growth. The rapid rate rises have failed to provide cut through so far, the wave of layoffs announced across the US technology sector have been absorbed by employment growth in other sectors.
Chart 2: US unemployment rate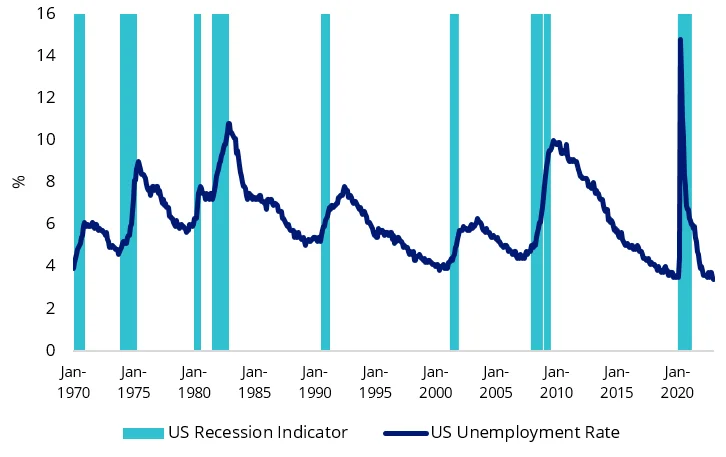
Source: Bureau of Labor Statistics
Chart 3: US Services Inflation YoY versus Wage Growth
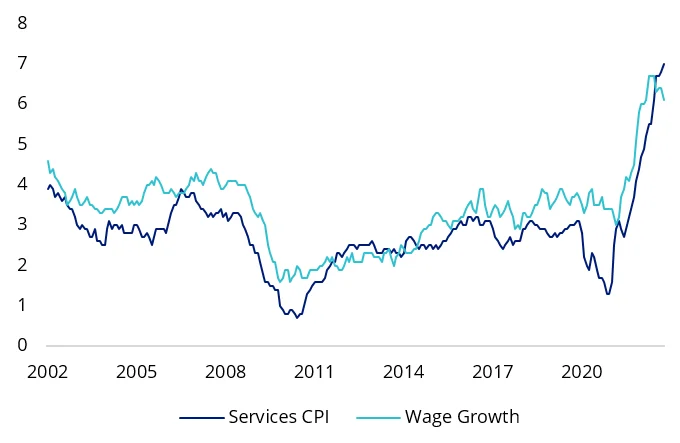
Source: Federal Reserve Bank of Atlanta, Bureau of Labor Statistics
Labour market resilience downplays the likelihood of a Fed ‘pivot’ in the second half of this year particularly so if China’s economic resurgence triggers a second wave of inflationary pressures, which ultimately would be positive for value companies. The market is hooked on the ‘hopium’ of a Fed pivot, pricing in lower long dated yields, benefiting the valuations of growth companies in recent months. However, this will likely be short lived once the market realises the extent of inflation ‘stickiness’, increasing long dated yields - the environment where value thrives.
Value companies are considered ‘short duration’, valuations are tied to current and near-term earnings, where earnings are typically linked to inflation. This means interest rate increases typically have less of an impact relative to growth companies where valuations are tied to the prospect of long-term future earnings. Periods of sustained inflation has been where value companies have consistently outperformed for example during the 1970s, early 1980s and 2000s following the dot com boom.
Chart 4: Performance comparison over 5 years p.a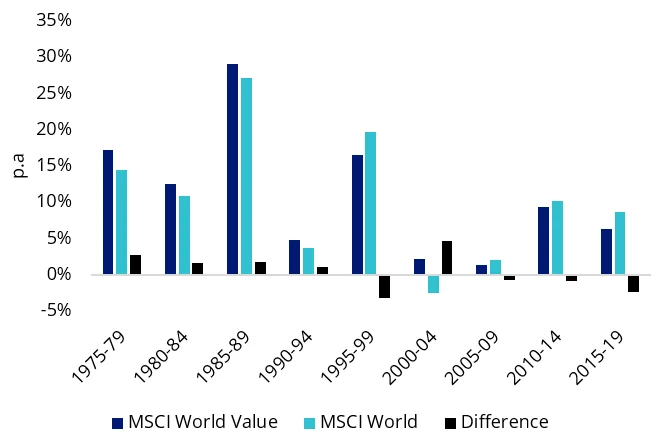
Source: MSCI. Past performance is not indicative of future results. You cannot invest directly in an index.
Chart 5: MSCI World Value outperformance by Inflation buckets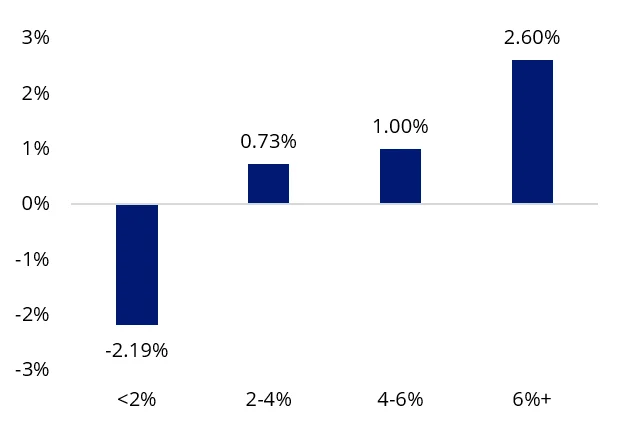
Source: MSCI, January 1975 to January 2023. Past performance is not indicative of future results. You cannot invest directly in an index.
The current macroeconomic environment could echo the period following the dot com boom fallout where economic weakness is primarily contained to the technology sector and value companies consistently outperformed, lasting 7 years between 2001 and 2007. First, investors are now seeking companies that have delivered sustainable earnings and dumping speculative growth companies. Secondly, the rapid increase in interest rates have resulted in an asset deflation bear market contributing to the compression in valuations between growth and value companies but likely has further room to go. There could be further compression if US technology companies announce subsequent rounds of layoffs to save balance sheet positions, like the dot com boom fallout.
Chart 6: 12m Forward PE: MSCI World Value versus Growth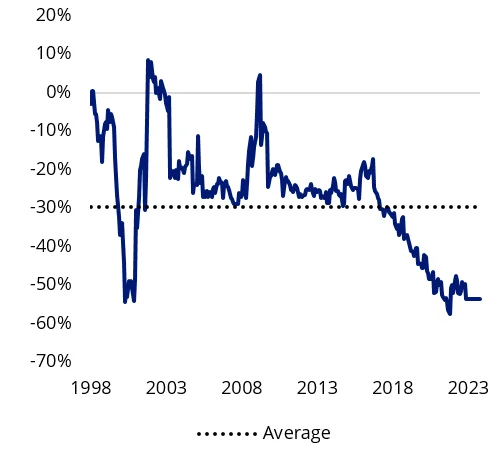
Source: Bloomberg, MSCI World Factor Indices.
Chart 7: 12m Forward PB: MSCI World Value versus Growth
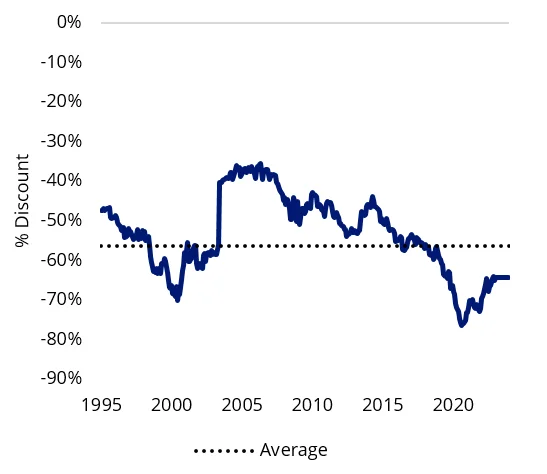
Source: Bloomberg, MSCI World Factor Indices.
Investors spooked by the dot com drawdown of tech shares sought the margin of safety provided by value companies which further benefited from the fact that the aftermath saw sustained economic growth and inflation until the global financial crisis. Average US CPI was 2.8 percent, sustainably above US Federal Reserve inflation target of 2 percent. US 10 year government bond yields steadily increased over this period, reflective of strong economic growth. A repeat event could be on the horizon.
Chart 8: Cumulative performance of MSCI World Enhanced Value versus MSCI World between recessions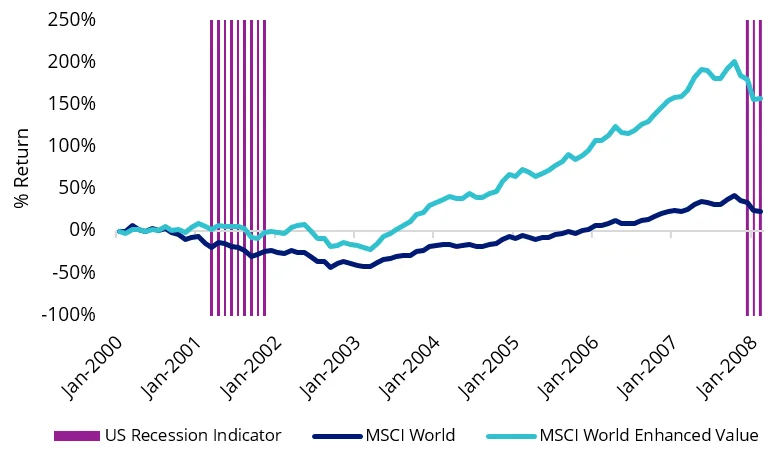
Source: Bloomberg. Past performance is not indicative of future results. You cannot invest directly in an index.
Access to value companies
Australian investors can now access entire portfolios of international securities selected on the basis of individual or multiple factors via a range of ETFs on ASX including the VanEck MSCI International Value ETF (ASX: VLUE). VLUE tracks the MSCI World ex Australia Enhanced Value Top 250 Select Index.
MSCI’s Enhanced Value Index applies three valuation ratio descriptors on a sector relative basis:
- price-to-book value;
- price-to-forward earnings; and
- enterprise value-to-cash flow from operations.
Compared to a traditional value approach, MSCI’s enhanced value overcomes many of the criticisms of value because it puts less weight on price-to-book as a metric and moves away from backward-looking dividend yield altogether. It uses a whole-firm valuation measure in enterprise value that could reduce concentration in leveraged companies. It also employs a sector neutral approach that MSCI found mitigates some of the drawdown inherent with the value investing style.
This blog first appeared on Livewire here.
Key risks
An investment VLUE carries risks associated with: ASX trading time differences, financial markets generally, individual company management, industry sectors, foreign currency, country or sector concentration, political, regulatory and tax risks, fund operations and tracking an index. See the PDS for details.


Published: 23 February 2023
Any views expressed are opinions of the author at the time of writing and is not a recommendation to act.
VanEck Investments Limited (ACN 146 596 116 AFSL 416755) (‘VanEck’) is the issuer and responsible entity of all VanEck exchange trades funds (Funds) listed on the ASX. This is general advice only and does not take into account any person’s financial objectives, situation or needs. The product disclosure statement (PDS) and the target market determination (TMD) for all Funds are available at vaneck.com.au. You should consider whether or not an investment in any Fund is appropriate for you. Investments in a Fund involve risks associated with financial markets. These risks vary depending on a Fund’s investment objective. Refer to the applicable PDS and TMD for more details on risks. Investment returns and capital are not guaranteed.
VLUE is indexed to a MSCI index. VLUE is not sponsored, endorsed or promoted by MSCI, and MSCI bears no liability with respect to VLUE or the MSCI Index. The PDS contains a more detailed description of the limited relationship MSCI has with VanEck and VLUE.