‘Til debt do us part
Through bull times and bear times, those investors who stay true to their ‘quality’ principles have reaped the rewards of accumulating wealth and preserving capital.
Through bull times and bear times, those investors who stay true to their ‘quality’ principles have reaped the rewards of accumulating wealth and preserving capital.
With the ‘value-rotation’ commencing in late 2021, cyclicals and those securities deemed ‘value’ have experienced strong returns however more recently those investors who stayed true to ‘quality’ rode through the value-trade with strong returns.
Ultra accommodative interest rates and gargantuan fiscal stimulus has meant the world is still on the debt binge it has been on for some time now. Coming into COVID-19 corporate balance sheets, especially in the US, were holding considerable amounts of debt. Now with net debt to GDP even higher and central banks reticent to intervene, any stress or unexpected event threatens to compromise the credit party and could be a catalyst for market volatility.
Goldman Sachs Non-Profitable Technology Index soared from March 2020 into the start of the year but since February 2021 it has crashed 32%.
If timing a crisis is shy of genius, then picking the next global mega tech is beyond brilliant. There is no doubt some of the stocks in the Goldman Sachs Non-Profitable Technology Index will become profitable and successful. But there are many that will not.
Think about the longest bull market in history following the GFC, those tech companies that drove the market’s returns were Apple, Alphabet, Microsoft and Facebook, companies with stable earnings and that weren’t burdened with debt. These are quality companies.
The current macro environment
Central banks and governments around the world have been doing all they can to stimulate economies. Given record low rates are expected, for at least the medium term,
many companies have taken advantage by issuing more and more debt. Figure 1 below shows that US corporate debt to GDP is now sitting at all-time-high levels. The rise of credit is unprecedented. The last time credit cycles peaked, based on a similar incline (pre-GFC), share markets collapsed.
Figure 1: US Total Credit to Non-Financial Corporations as a % of GDP
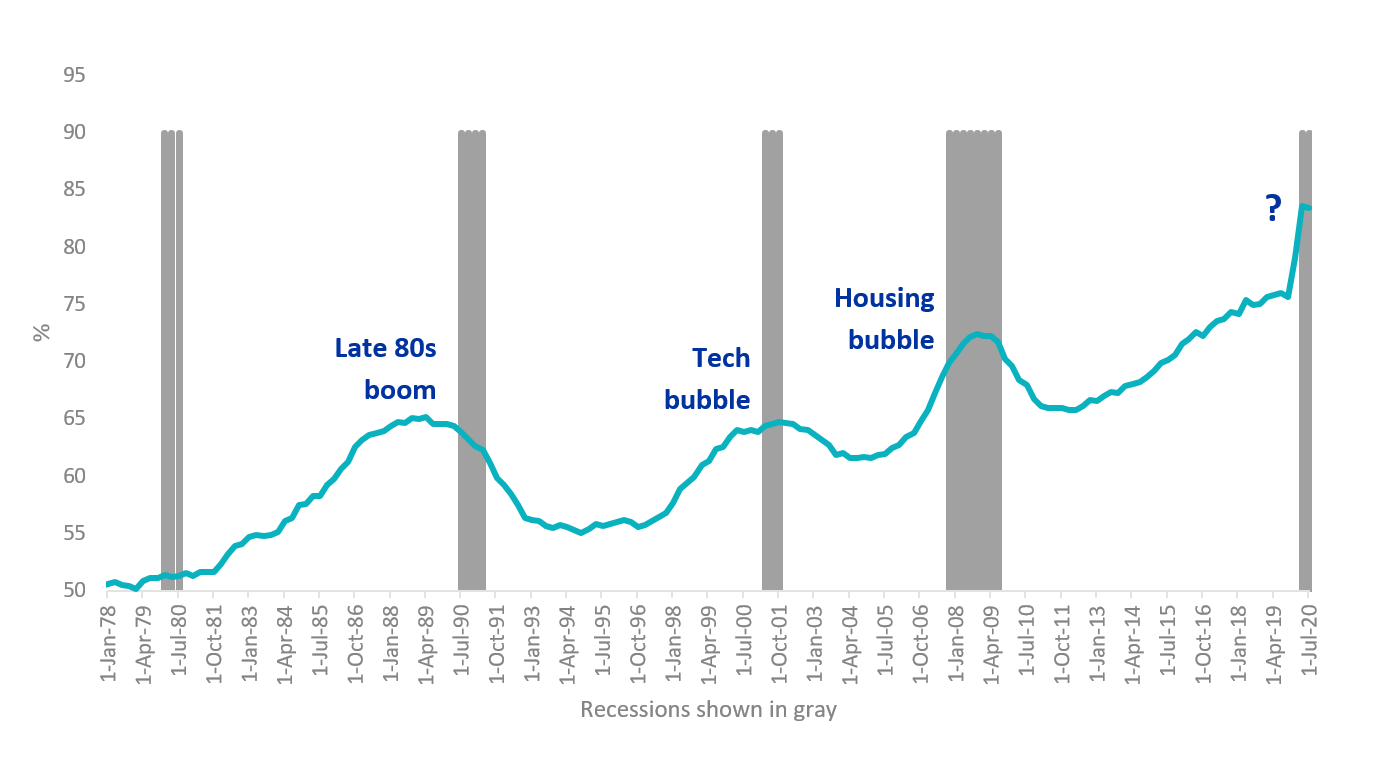
Source: St Louis Fed, VanEck, 1978 to 2019
At the same time corporates have been leveraging the share prices of companies with ‘negative earnings’, which until very recently, have been skyrocketing. The Goldman Sachs Non-Profitable Technology Index, often referred to as the ‘negative earnings’ company index, rose exponentially from a low in March 2020 to a record-high in February 2021. It has since fallen over 30%, which should give investors time for pause.
Figure 2: The Goldman Sachs Non-Profitable Technology Index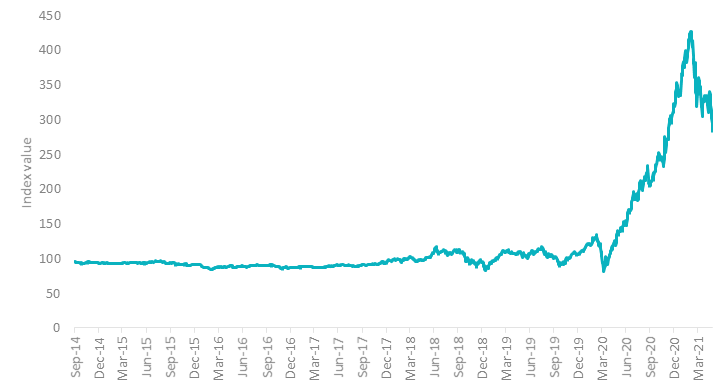
Source: Goldman Sachs, Bloomberg. Available data from 10 September 2014 to 7 May 2021. The calculations for the above include the reinvestment of all dividends but do not include fees and other costs with an investment. You cannot invest in an index. Past performance is not a reliable indicator of future performance.
Quality may outperform
While low rates have encouraged companies to take on more risk, economic growth among developed countries isn’t matching equity market enthusiasm. US jobs growth also unexpectedly slowed in April. The economic recovery, unlike the share market recovery, is not going to be rapid. In a low growth environment, companies that traditionally do well have the following characteristics:
- Value creating return on equity (ROE) – a ROE above 15%;
- Attractive growth profile – above average earning per share (EPS) growth;
- Sustainable earnings – demonstrated across multiple business cycles; and
- Strong balance sheets – gearing ratios ~50% with strong net cash positions.
The MSCI World ex Australia Quality Index (Quality Index) only includes the 300 highest quality scoring stocks determined by MSCI based on three easily identifiable financial characteristics:
- High ROE;
- Stable year-on-year earnings growth; and
- Low financial leverage.
Figure 3: Quality Index characteristics
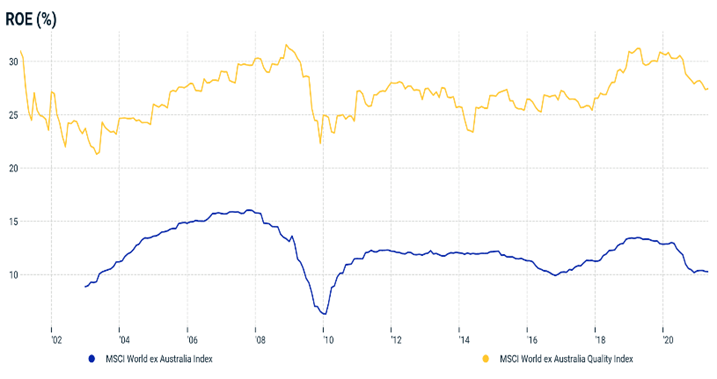
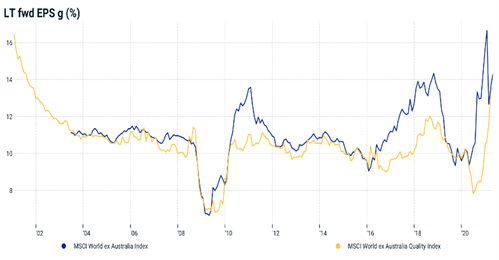
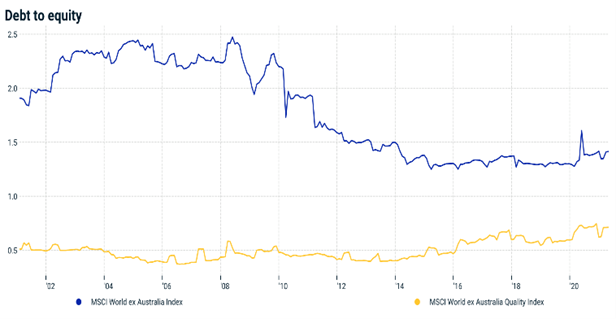
Source: MSCI, 31 December 1998 to 30 April 2021. Return on equity at an index level, calculated using the index earnings divided by the index book value, At an index level, the Long-Term Forward EPS Growth is the weighted average of the consensus of analysts’ earnings growth rate estimates for each constituent, typically provided for the next 3 to 5 years. Leverage is the sum of the most recent book value of common equity plus preferred equity plus long-term debt, divided by book value of common equity. This is free-float market capitalisation weighted. The MSCI World ex Australia Index (“MSCI World ex Aus”) is shown for comparison purposes as it is the widely recognised benchmark used to measure the performance of developed market large- and mid-cap companies, weighted by market capitalisation. QUAL’s index measures the performance of 300 companies selected from MSCI World ex Aus based on MSCI quality scores, weighted by market cap x quality score at rebalance. Consequently QUAL’s index has fewer companies and different country and industry allocations than MSCI World ex Aus. Click here for more details
In the case of quality international companies there are still reasons to be optimistic. Some analysts suggest the expedited roll-out of vaccine, optimism about continued government support and any breakthrough on US-China trade will drive equity markets higher. On the other side of the coin, concerns about COVID mutant variants and new waves, inflationary shocks or a credit event weigh on markets. There are arguments for the bulls and the bears.
Performance in bull and bear markets
Over the long term, the Quality Index has demonstrated outperformance. Notably, the Quality Index has significantly outperformed in previous down market environments such as the GFC bear market and periods of low rates and low inflation, as the chart below shows.
Figure 4: Quality Index performance
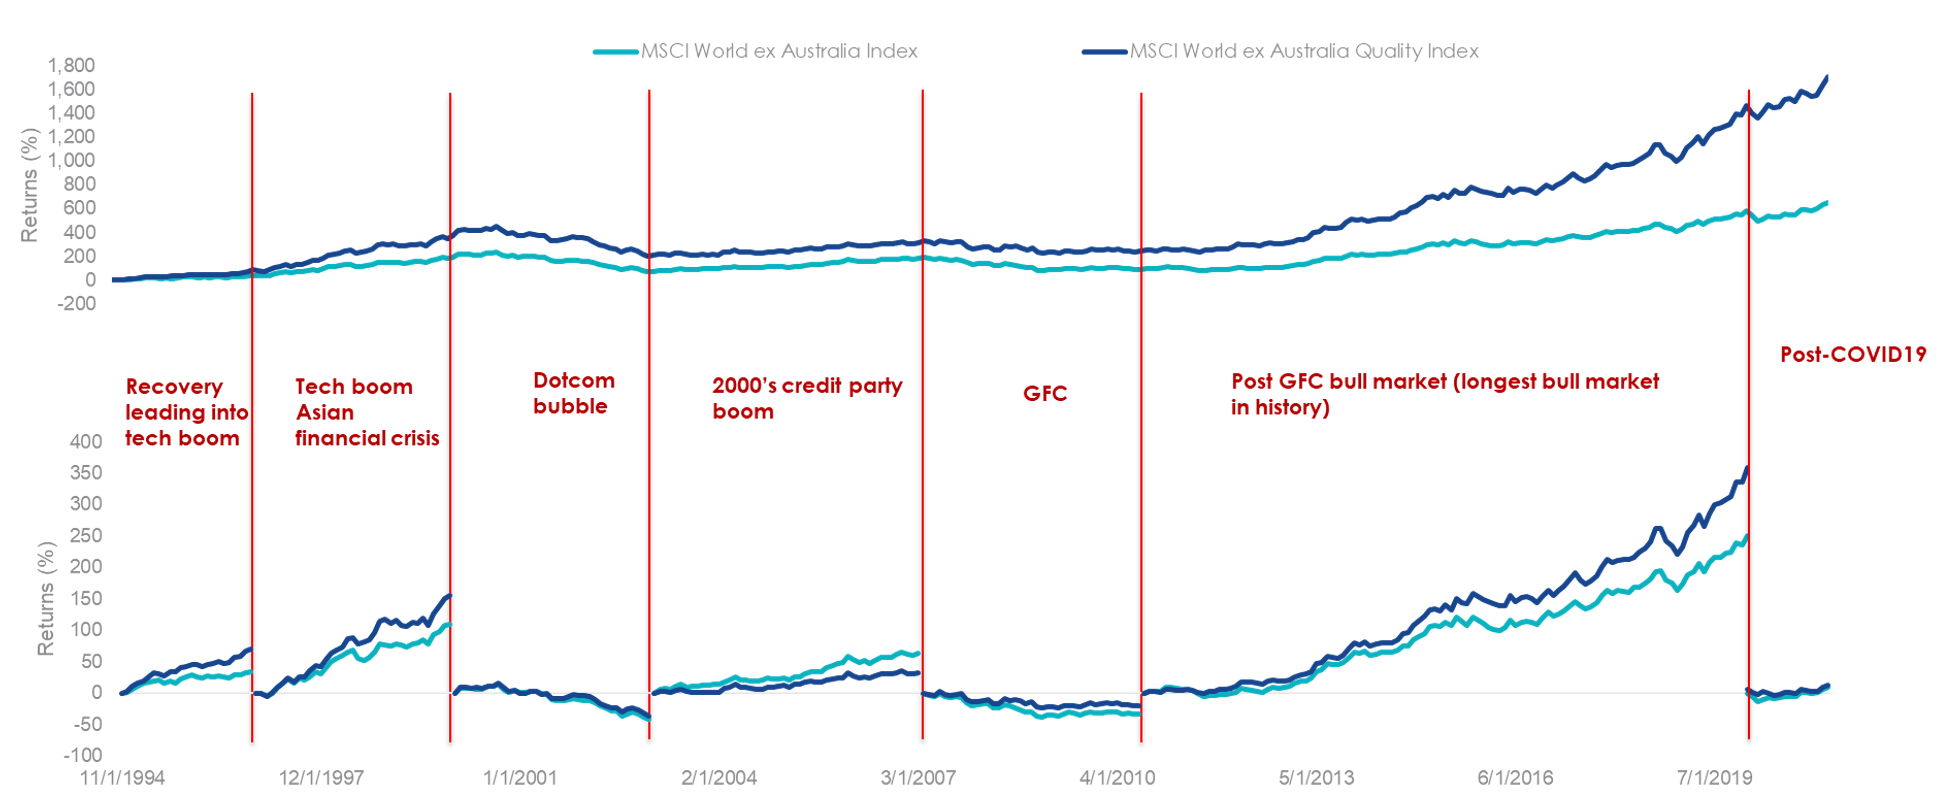
Source: Morningstar Direct, VanEck. 30 November 1994 – 30 April 2021 Source: VanEck, Morningstar Direct. The above graph is a hypothetical comparison of performance of the Index and the parent index. Results are calculated to the last business day of the month and assume immediate reinvestment of all dividends and exclude costs associated with investing in the ETF. You cannot invest directly in the Index. The above performance information is not a reliable indicator of current or future performance of the indices or QUAL, which may be lower or higher. The MSCI World ex Australia Index (“MSCI World ex Aus”) is shown for comparison purposes as it is the widely recognised benchmark used to measure the performance of developed market large- and mid-cap companies, weighted by market capitalisation. QUAL’s index measures the performance of 300 companies selected from MSCI World ex Aus based on MSCI quality scores, weighted by market cap x quality score at rebalance. Consequently QUAL’s index has fewer companies and different country and industry allocations than MSCI World ex Aus. Click here for more details.
For bearish investors, negative outcomes or the potential for losses are the ‘risks’ they consider. A measure called ‘drawdown’ is useful for investors to assess this risk. It demonstrates both the depth of a fall from an historical peak and the pace of the recovery to a new peak. The maximum drawdown is the distance from the highest peak to the deepest valley. Investments that fall less and recover faster are more desirable.
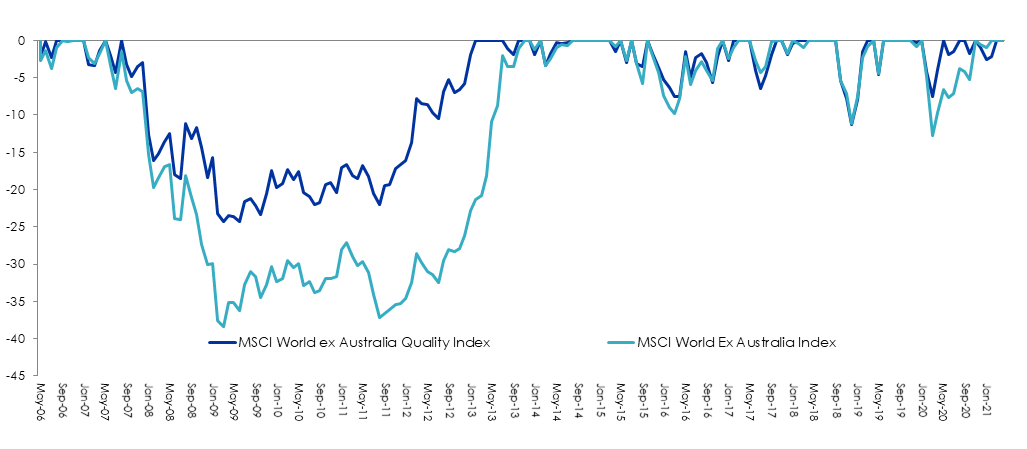
The chart below shows the drawdown of the Quality Index versus the broader MSCI World ex Australia Index (‘benchmark’) for the past 15 years, capturing the GFC. In summary:
- The maximum drawdown of the Quality Index was -24.28% versus the benchmark’s much bigger fall of 37.79%
- The pace of recovery of the Quality Index was eight months faster than the benchmark.
Figure 5: Drawdown 1 May 2006 to 30 April 2021 (%)
Source: Morningstar Direct. The calculations for the above include the reinvestment of all dividends but do not include fees and other costs with an investment in the fund. You cannot invest in an index. Past performance is not a reliable indicator of future performance of QUAL’s Index or QUAL. The MSCI World ex Australia Index (“MSCI World ex Aus”) is shown for comparison purposes as it is the widely recognised benchmark used to measure the performance of developed market large- and mid-cap companies, weighted by market capitalisation. QUAL’s index measures the performance of 300 companies selected from MSCI World ex Aus based on MSCI quality scores, weighted by market cap x quality score at rebalance. Consequently QUAL’s index has fewer companies and different country and industry allocations than MSCI World ex Aus. Click here for more details.
The VanEck Vectors MSCI World ex Australia Quality ETF (QUAL) tracks the Quality Index.
It’s important to stay diversified and with a single trade on ASX you can use QUAL to invest in 300 quality international companies and potentially achieve long-term outperformance through greater diversification via exposure to international equities with reduced volatility through quality screening. It’s also important to stay true to the ‘factor.’ While quality underperformed as value made a comeback in late 2020, it has since recovered well. We recently wrote about this - click here.
QUAL has outperformed since its inception
|
1 Month (%) |
3 Months (%) |
1 yr (%) |
2 yrs (% p.a.) |
3 yrs (% p.a.) |
4 yrs (% p.a.) |
5 yrs (% p.a.) |
Since Inception (% p.a.) |
|
|
QUAL |
3.69 |
9.84 |
18.94 |
16.94 |
18.35 |
16.78 |
16.90 |
16.58 |
|
MSCI World ex Australia Index |
3.18 |
10.21 |
23.03 |
12.84 |
13.32 |
13.09 |
13.85 |
13.57 |
|
Outperformance |
+0.51 |
-0.37 |
-4.09 |
+4.10 |
+5.03 |
+3.69 |
+3.05 |
+3.01 |
*Inception date is 29 October 2014. Source: Morningstar Direct, VanEck as at 30 April 2021. The chart above shows past performance of QUAL and of the MSCI World ex Australia Index. You cannot invest directly in an index. Results are calculated to the last business day of the month and assume immediate reinvestment of distributions. QUAL results are net of management fees and other costs incurred in the fund, but before brokerage fees and bid/ask spreads incurred when investors buy/sell on the ASX. Returns for periods longer than one year are annualised. Past performance is not a reliable indicator of future performance. The MSCI World ex Australia Index (“MSCI World ex Aus”) is shown for comparison purposes as it is the widely recognised benchmark used to measure the performance of developed market large- and mid-cap companies, weighted by market capitalisation. QUAL’s index measures the performance of 300 companies selected from MSCI World ex Aus based on MSCI quality scores, weighted by market cap x quality score at rebalance. Consequently QUAL’s index has fewer companies and different country and industry allocations than MSCI World ex Aus. Click here for more details.


Published: 20 May 2021
VanEck Investments Limited ACN 146 596 116 AFSL 416755 (‘VanEck’) is the responsible entity and issuer of units in the VanEck Vectors MSCI World ex Australia Quality ETF (QUAL), VanEck Vectors MSCI World ex Australia Quality (Hedged) ETF (QHAL) and VanEck Vectors MSCI International Small Companies Quality ETF (QSML). This is general advice only, not personal financial advice. It does not take into account any person’s individual objectives, financial situation or needs. Read the PDS and speak with a financial adviser to determine if the fund is appropriate for your circumstances. The PDS is available here
QUAL, QHAL, QSML invest in international markets. An investment in QUAL, QHAL or QSML has specific and heightened risks that are in addition to the typical risks associated with investing in the Australian market. These include currency risks from foreign exchange fluctuations, ASX trading time differences and changes in foreign laws and regulations including taxation.
QUAL, QHAL and QSML are indexed to a MSCI index. The ETFs are not sponsored, endorsed, or promoted by MSCI, and MSCI bears no liability with respect to QUAL, QHAL, QSML or the MSCI Index. The PDSs contain a more detailed description of the limited relationship MSCI has with VanEck and the ETFs.