Australian companies shine during February earnings season
As we come to the final week of Australia’s February earnings season, so far, earnings have fared better than expected with beats outweighing misses 2:1.
Chart 1: S&P/ASX 200 February 2024 earnings result split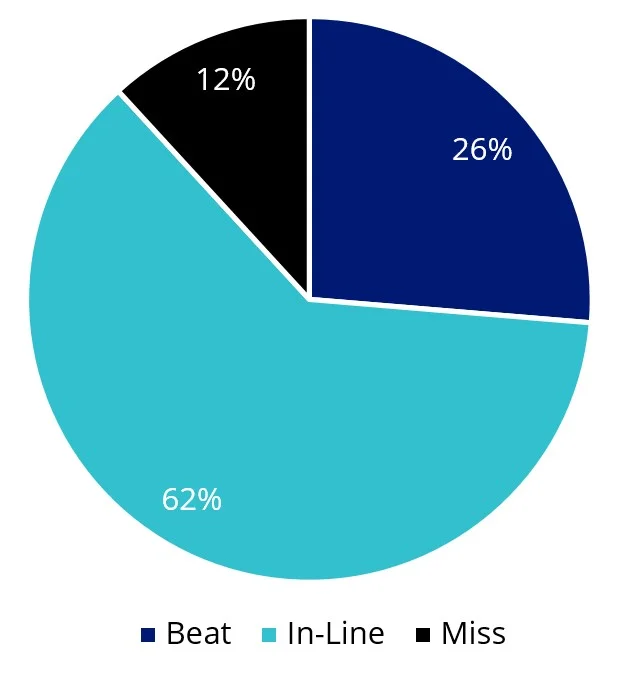
Source: Bloomberg, Index Weighted, as at 21 February 2024, ±2.5% range for beat/miss.
The consumer discretionary sector’s prices jumped on average by 3.79% post-earnings result. Strong results are a byproduct of Australia’s economic and consumer resilience despite the rapid increase in the RBA cash rate. Wesfarmers was the standout with earnings 4% ahead of consensus, benefiting from moderation in inflationary cost input pressures and Kmart delivering strong growth in high-margin segments. Bunnings’s earnings were in line with consensus.
Australia’s largest bank CBA’s share price rose 0.21% despite reporting a contraction in net interest margin and lower earnings compared to the previous calendar year. CBA CEO Matt Comyn noted that “our lower cash profit reflects cost inflation and a competitive operating environment.” However, despite the cautious tone, the market seems to be pricing a dream scenario for CBA, despite the risks of a flare-up in mortgage stress in a prolonged higher interest rate environment. 15 of the 16 sell-side analysts surveyed in Bloomberg have CBA as a sell recommendation. Australia’s banks when compared globally are also the most expensive in the developed world by 12-month forward price to earnings and price to book.
Chart 2: Global bank valuations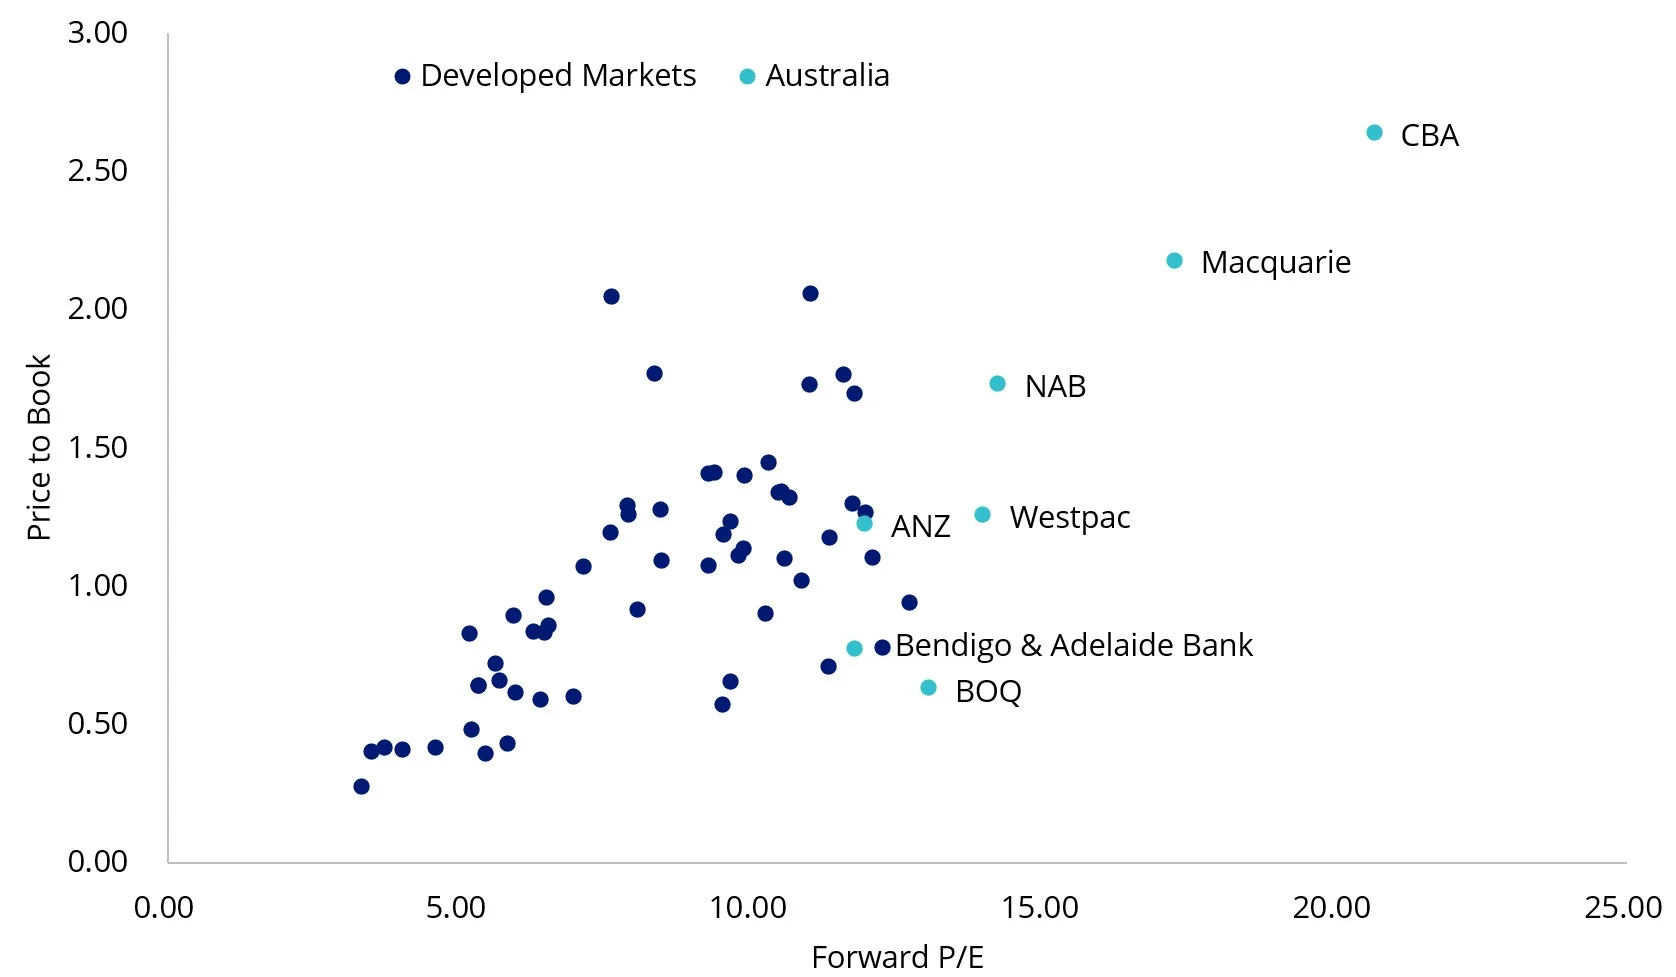
Source: Bloomberg, as at 23 February 2024.
Chart 3: CBA sell-side price recommendations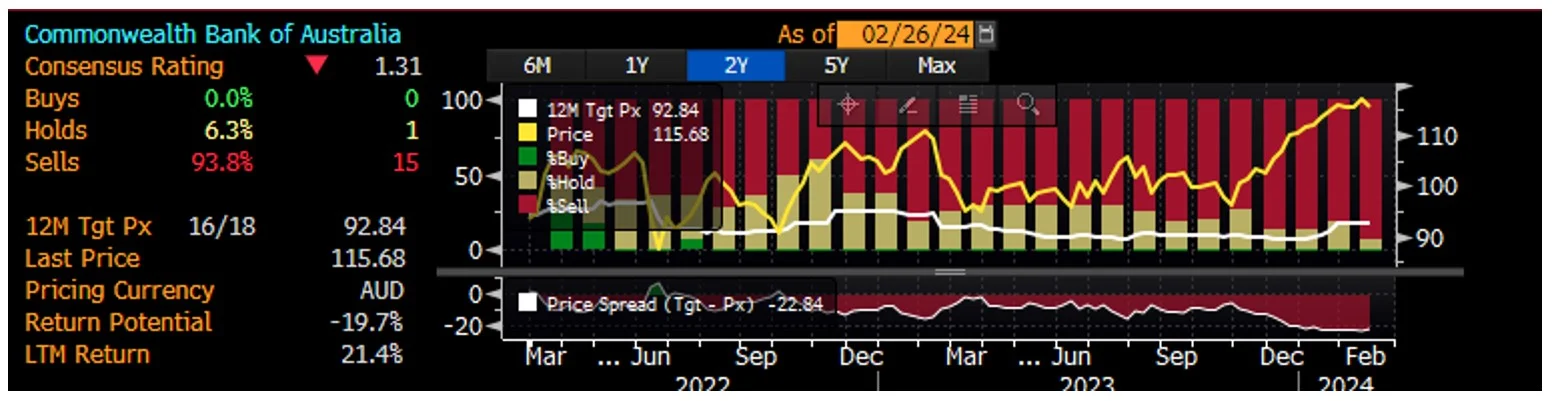
Source: Bloomberg, as at 26 February 2024.
Real Estate fared better than market expectations across industrials, office and retail despite market concerns about the sector's ability to withstand a higher for longer rates environment. Industrial REIT Goodman group surged 6.24%, reporting an 11% increase in earnings and acceleration in its data centre development pipeline. Retail REIT Scentre Group which operates Westfield destinations benefited from resilient consumer spending with its occupancy rate increasing to 99.2%. Office REIT Dexus reported a healthy 4% increase in net operating income across its office portfolio.
Chart 4: Price change post earnings result by sector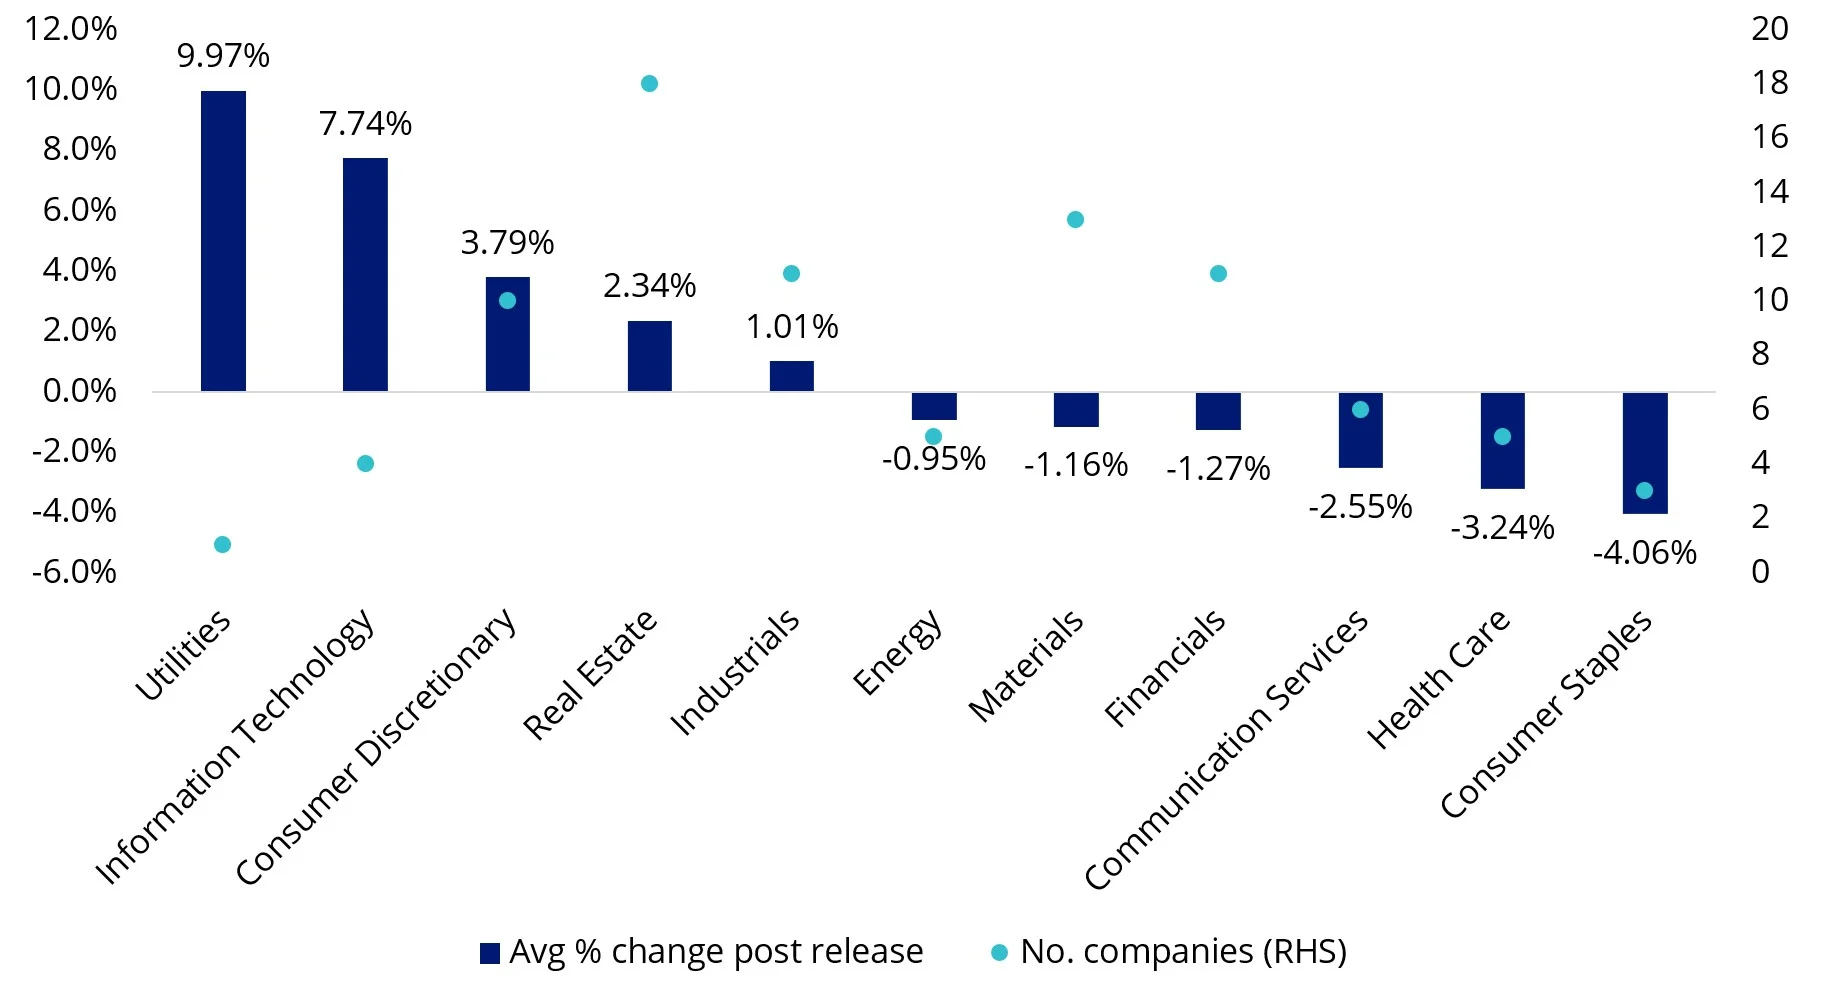
Source: Bloomberg, Index Weighted, as at 23 February 2024. S&P/ASX 200 sector indices.
Outlook
While Australian companies fared better than expected, the market is a touch too optimistic on Australia’s economic outlook, we think. Inflationary pressures seem to be more pronounced locally than globally, requiring the RBA to keep rates on hold for longer. There is an outside chance of another rate hike. Rent, energy and food inflation are higher than pre-COVID levels, and the RBA will need to monitor these. Companies also noted an acceleration in labour costs, driving the implementation of cost management initiatives to protect margins.
A higher for longer interest rates environment could result in mortgage stress increasing, adversely impacting Australia’s Big 4 banks. On the flip side, Australia’s migration surge could see a strange dynamic that helps keep headline consumer spending strong and by extension support companies involved in consumer discretionary, real estate and industrials, despite household budgets stretched. For example, we’ve seen house prices increase despite the rapid increase in the RBA cash rate and aggregate consumer spending increase by per capita decrease.
Investors concerned about an overexposed portfolio position to Australia’s banks should consider VanEck Australian Equal Weight ETF (MVW). The index MVW tracks equally weights the largest and most liquid stocks on the ASX at each rebalance. A consequence of the equal weight methodology is that MVW relative to the S&P/ASX 200 is underweight those sectors that contain larger than average companies. For example, MVW is currently underweight the banking sector by 13.73% compared to the S&P/ASX 200. Conversely, it is overweight sectors that contain smaller than average companies. MVW is currently overweight industrials by 8.81%, real estate by 4.53% and information technology by 1.62%. Therefore, MVW has less sector concentration risk than the S&P/ASX 200. Australian mid-caps, small-caps and equal weight recorded a higher average upward price target revision than the S&P/ASX 200 during the latest earnings season.
Chart 5: MVW and S&P/ASX 200 sector weightings (%)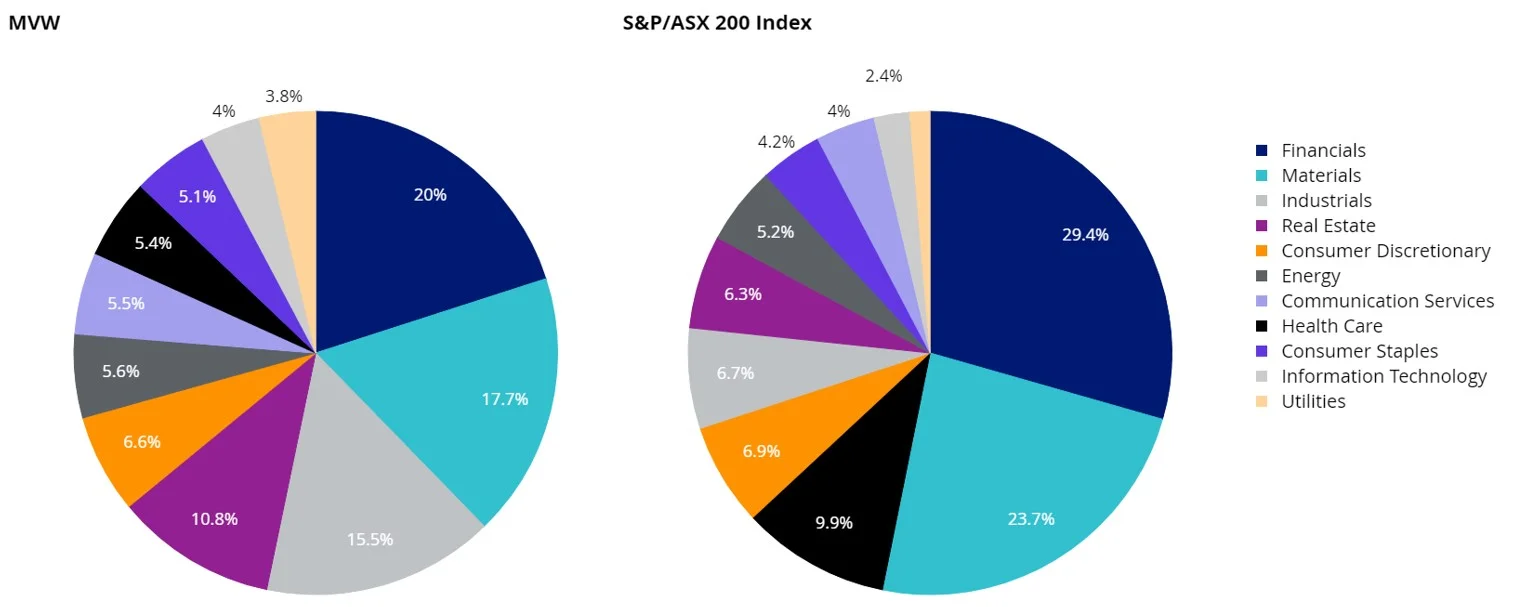
Source: FactSet, 31 January 2024.
Chart 6: 12 month consensus price target revisions during earnings season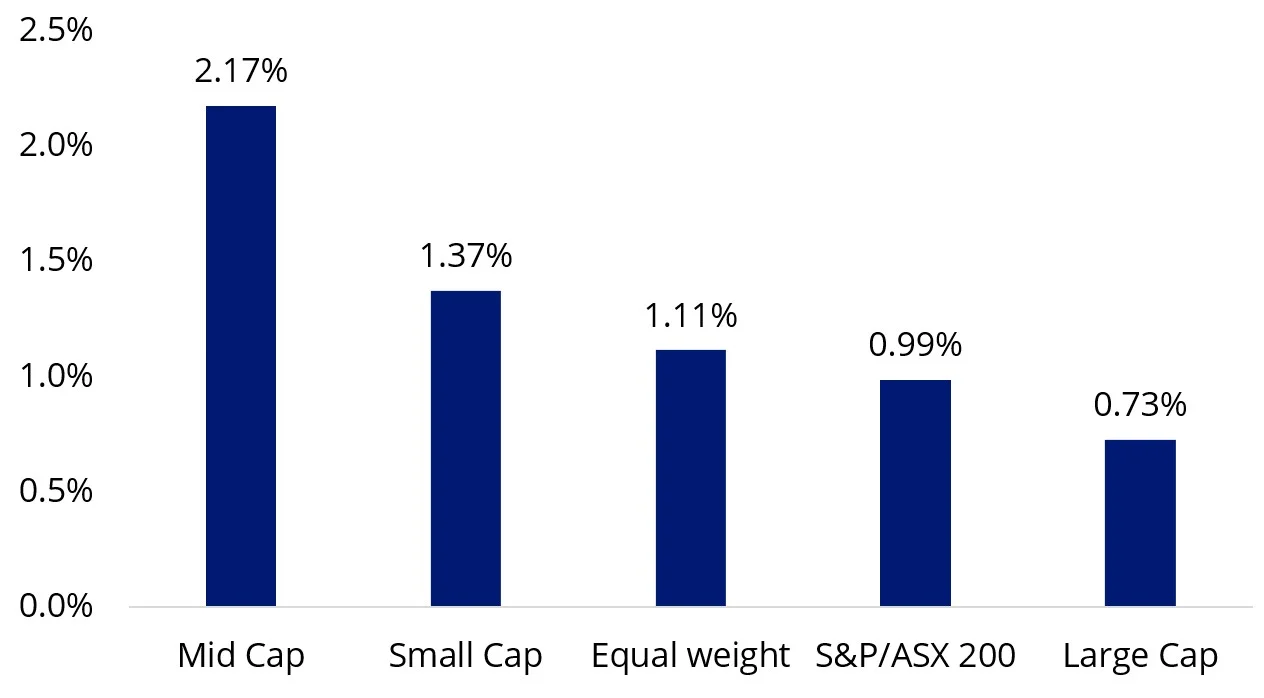
Source: Bloomberg, 31 January to 23 February 2024, Large Cap as S&P/ASX 20, Mid Cap as S&P/ASX Mid Cap 50, Small Cap as S&P/ASX Small Ordinaries, Equal Weight as MVIS Australia Equal Weight. The ASX index series is shown for comparison purposes as it is the widely recognised benchmark series used to measure the performance of the Australian equities market. It weights companies by market capitalisation. MVW’s index (MVIS Australia Equal Weight) measures the performance of the largest and most liquid ASX-listed companies, weighted equally at rebalance. MVW’s index has a different amount of companies and different industry allocations than the S&P/ASX indices.
Key risks
All investments carry risks. These include risks associated with financial markets generally, individual company management, industry sectors, fund operations and tracking an index. See the PDS for details


Published: 27 February 2024
Any views expressed are opinions of the author at the time of writing and is not a recommendation to act.
VanEck Investments Limited (ACN 146 596 116 AFSL 416755) (VanEck) is the issuer and responsible entity of all VanEck exchange traded funds (Funds) trading on the ASX. This is general advice only and does not take into account any person’s financial objectives, situation or needs. The product disclosure statement (PDS) and the target market determination (TMD) for all Funds are available at vaneck.com.au. You should consider whether or not an investment in any Fund is appropriate for you. Investments in a Fund involve risks associated with financial markets. These risks vary depending on a Fund’s investment objective. Refer to the applicable PDS and TMD for more details on risks. Investment returns and capital are not guaranteed.
MVIS Australia Equal Weight Index (‘MVIS Index’) is the exclusive property of MV Index Solutions GmbH based in Frankfurt, Germany (‘MVIS’). MVIS is a related entity of VanEck. MVIS makes no representation regarding the advisability of investing in the Fund. MVIS has contracted with Solactive AG to maintain and calculate the MVIS Index. Solactive uses its best efforts to ensure that the MVIS Index is calculated correctly. Irrespective of its obligations towards MVIS, Solactive has no obligation to point out errors in the MVIS Index to third parties.