The chart that stood out during reporting season
One chart stood out to us during the past reporting season, and it has implications for all Australian equity investors.
Australian listed corporations had a better-than-expected February 2024 reporting season with beats beating misses by a factor or 1½ :1.
Chart 1: S&P/ASX 200 February 2024 earnings result split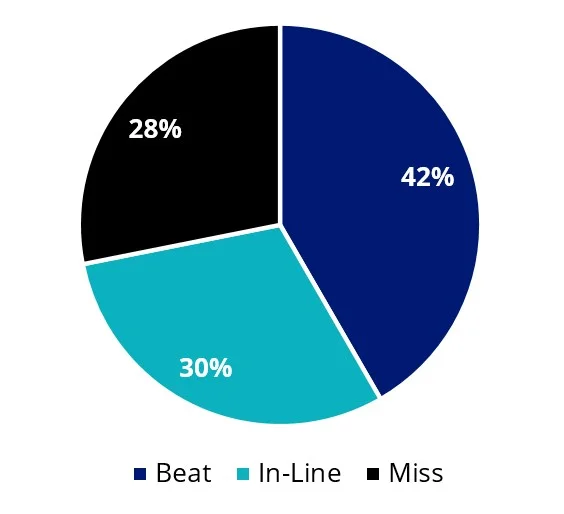
Source: Bloomberg, Index Weighted, as at 29 February 2024, ±2.5% range for beat/miss.
The results had analysts revising their price targets. The chart of these revisions, stood out to us.
Chart 2: 2024 Price target revisions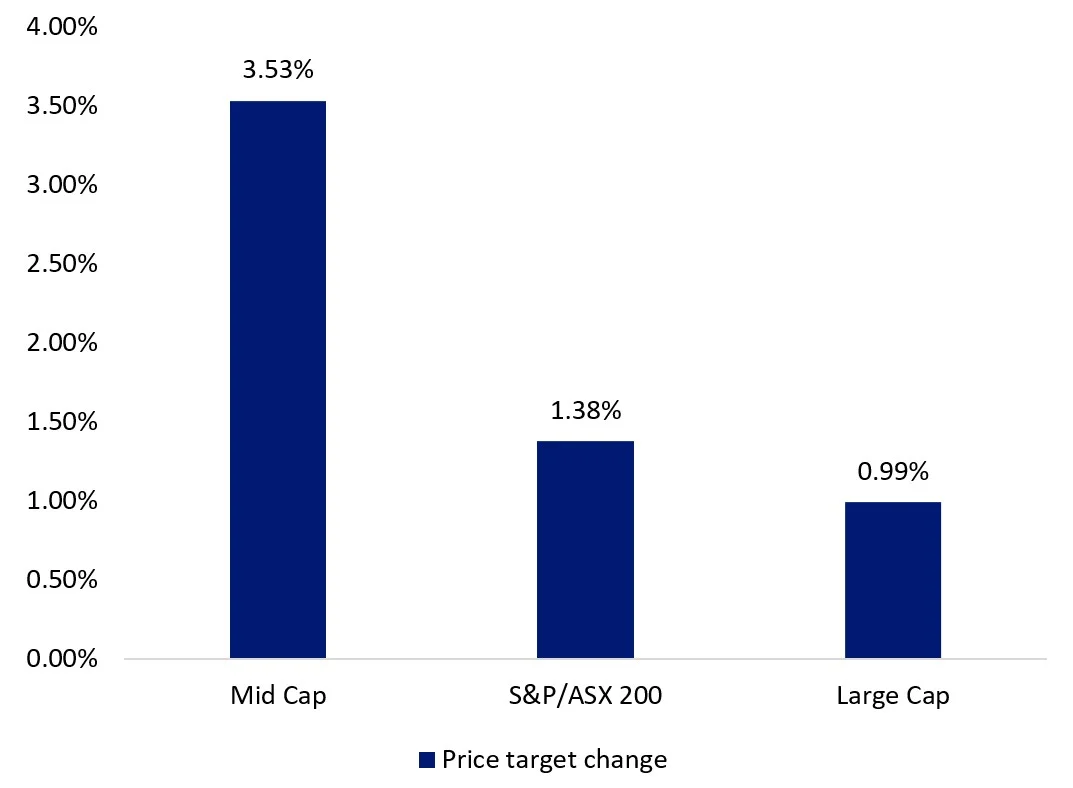
Source: FactSet, 6 March 2024, Large Cap as S&P/ASX 20, Mid cap is S&P/ASX MidCap 50.
Mid-caps recorded the highest average upward price target revision compared to the large-caps and the broader Australian equities market. Looking further ahead, estimated 3 to 5 years earnings per share (EPS) growth shows a similar story.
Chart 3: Estimated 3 to 5 years earnings (EPS) per share growth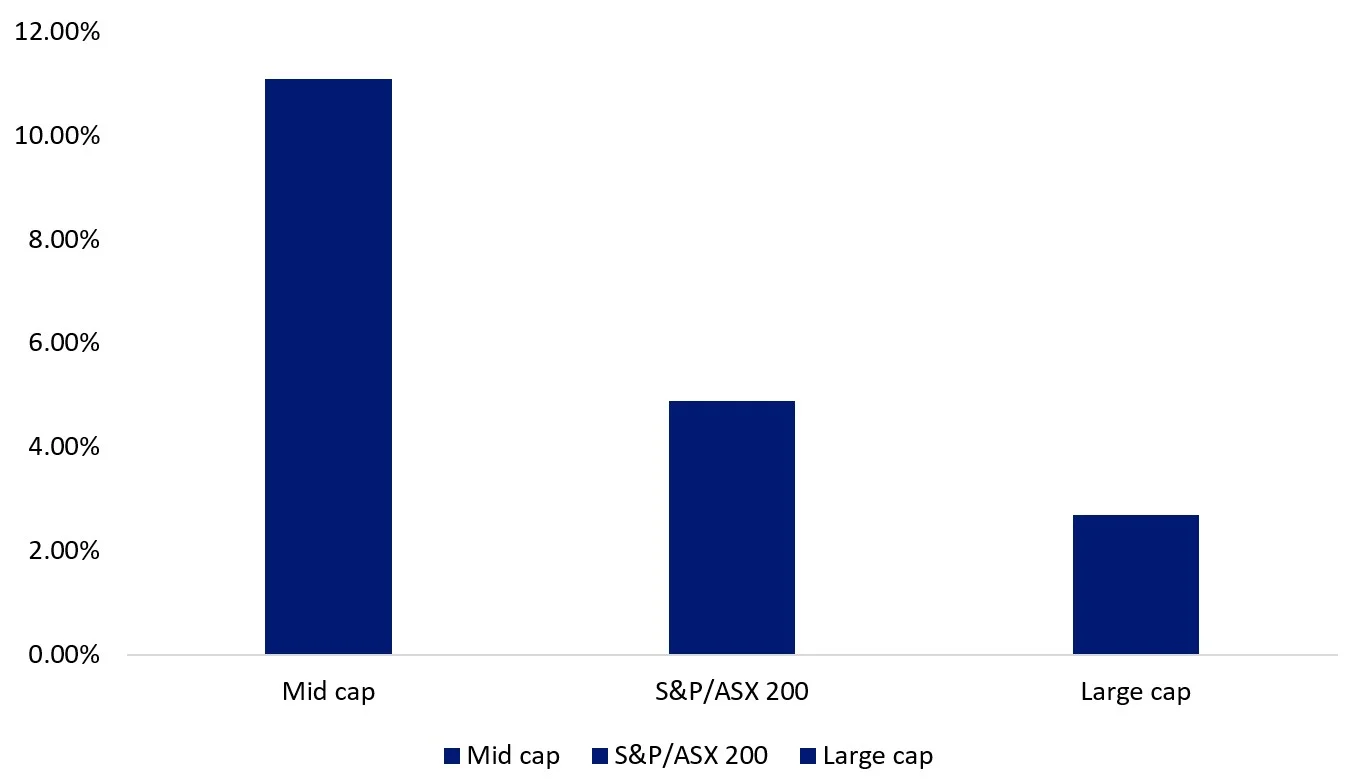
Source: FactSet, 6 March 2024, Large Cap as S&P/ASX 20, Mid cap is S&P/ASX MidCap 50.
It would make sense therefore for Australian equity funds to have more exposure to the mid caps stocks than the large caps. However, because most Australian equity portfolios, passive and active, are linked to the S&P/ASX 200 Index these portfolios are likely to have more significant exposure to large caps than mid caps. A purely passive exposure, ie one that tracks the S&P/ASX 200, or similar, only has around 12% exposure to stocks 51-100, ie the mid caps.
Active funds are likely to have a similar profile. The way many active fund managers construct their portfolios is to hold positions similar to recognised indices, such as the S&P/ASX 200, otherwise, they are taking a big risk. If markets go against them and they drastically underperform the index, they will be seen as incompetent. Better to be just above or just below the index.
Putting two and two together, it's likely your Australian equity portfolio is underrepresented by mid-caps. Mid-caps offer the best of both small and mega-caps. They represent a mix of established and still developing companies and a balance between the spirit and youth of small-caps and the stability of large-companies.
Some of the best-known large-caps started as small-caps then grew to be titans of their industry. Finding a hidden gem is one of the greatest potential benefits of investing in small companies but it also comes with a lot more risk because they can fail spectacularly.
At the other end of the spectrum, mega-caps have more stability than mid or small-caps because of their size. Because of this, they are often less agile than their mid-and small-cap peers.
The VanEck S&P/ASX MidCap ETF (ASX: MVE) is the only ETF listed on ASX that tracks the S&P/ASX MidCap 50 Index. Through one trade, investors can access a portfolio of 50 stocks and gain instant access to this ‘sweet spot’ of the Australian equity universe.
Since their launch, the S&P/ASX MidCap 50 index has outperformed both Australian large-and small-caps and the broad S&P/ASX 200 benchmarks.
Chart 4: Performance April 2000 to February 2024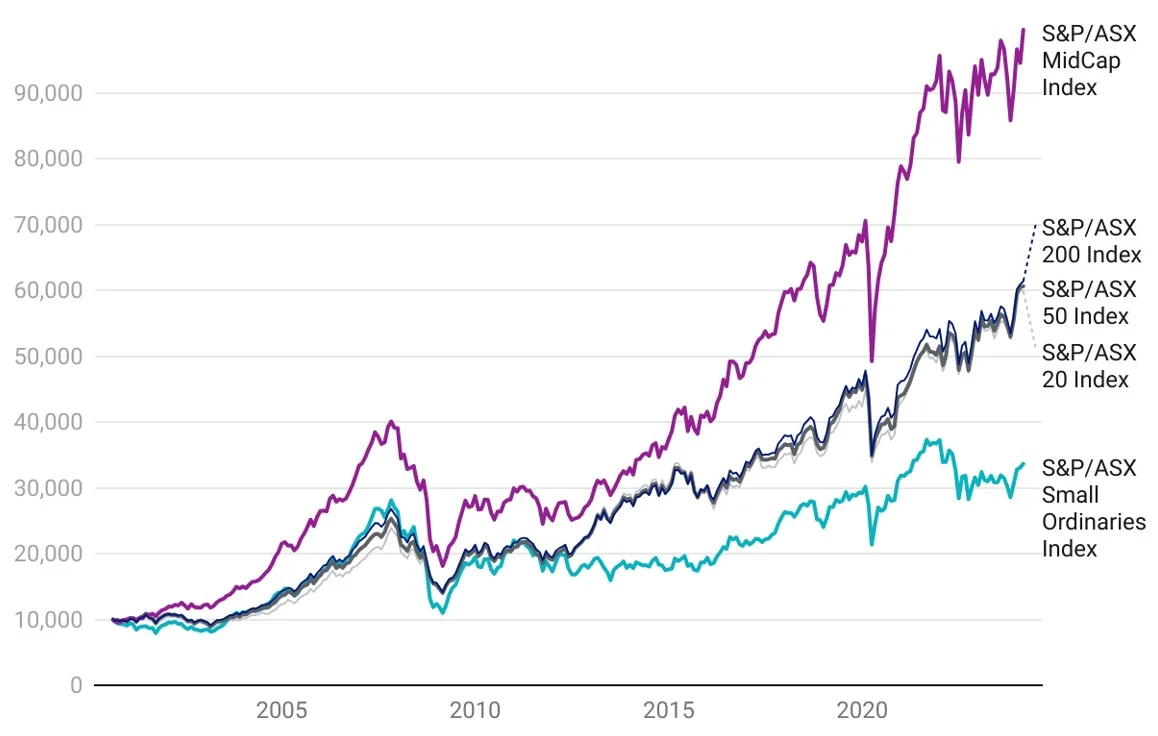
Source: VanEck, Morningstar, since the inception of S&P/ASX index series (4 April 2000) to 29 February 2024. Rebased to 10,000 for illustrative purposes only. Results are calculated to the last business day of the month and assume immediate reinvestment of all dividends and exclude costs associated with investing in MVE. You cannot invest directly in an index. Past performance is not a reliable indicator of future performance
Considering returns and risks
The following table shows the trailing performance of the S&P/ASX MidCap 50 Index in comparison to other key S&P/ASX indices to 29 February 2024. The S&P/ASX MidCap 50 Index delivered the best performance so far this year and over 5, 10, 15 and 20-year periods.
Table 1: Trailing returns of the S&P/ASX index series
|
YTD |
1 Year |
3 Years |
5 Years |
10 Years |
15 Years |
20 Years |
|
|
S&P/ASX 200 |
1.99 |
10.64 |
9.32 |
8.61 |
7.95 |
10.28 |
8.77 |
|
S&P/ASX 20 |
0.96 |
11.11 |
10.19 |
9.37 |
7.38 |
10.12 |
9.11 |
|
S&P/ASX 50 |
1.87 |
11.25 |
10.29 |
8.89 |
7.73 |
10.25 |
8.87 |
|
S&P/ASX Small Ordinaries |
2.63 |
7.84 |
1.39 |
4.42 |
6.07 |
7.74 |
5.60 |
|
S&P/ASX MidCap 50 |
3.06 |
8.25 |
8.99 |
10.39 |
11.26 |
12.03 |
9.82 |
Source: VanEck, Morningstar, as at 29 February 2024. Results are calculated to the last business day of the month and assume immediate reinvestment of all dividends and exclude costs associated with investing in an ETF. You cannot invest directly in an index. Past performance is not a reliable indicator of future performance.
Investors may worry this return might come with too much risk. The Sharpe ratio combines the return measure with a volatility (risk) measure to quantify the relationship between the returns and risk. The greater the value of the Sharpe ratio, the better the risk adjusted return. The table below shows that the S&P/ASX MidCap 50 Index has delivered the best risk-adjusted returns over 10 and 15 years.
Table 2: Sharpe ratio of the S&P/ASX index series
|
1 Year (%) |
3 Years |
5 Years |
10 Years |
15 Years |
20 Years |
|
|
S&P/ASX 200 |
0.59 |
0.58 |
0.50 |
0.50 |
0.62 |
0.44 |
|
S&P/ASX 20 |
0.65 |
0.65 |
0.57 |
0.47 |
0.60 |
0.47 |
|
S&P/ASX 50 |
0.67 |
0.67 |
0.53 |
0.49 |
0.62 |
0.46 |
|
S&P/ASX Small Ordinaries |
0.31 |
0.06 |
0.24 |
0.33 |
0.38 |
0.21 |
|
S&P/ASX MidCap 50 |
0.32 |
0.48 |
0.52 |
0.63 |
0.65 |
0.46 |
Source: VanEck, Morningstar, as at 29 February 2024. Common inception is launch date of &P/ASX 300 ex S&P/ASX 20 Index (1 July 2013). Results are calculated to the last business day of the month and assume immediate reinvestment of all dividends and exclude costs associated with investing in MVE. You cannot invest directly in an index. Past performance is not a reliable indicator of future performance.
Let’s walk through some of the other differences between the indices.
S&P/ASX Index Series - Top 10 holdings
Below you can see the top 10 companies of each index. In the S&P/ASX 200, the top 10 make up over 45% of the index. Investors seeking diversification from a portfolio of 200 or 50 stocks would not expect that level of concentration. In these indices, the small-sized companies outside of the top 10 would not have much impact on performance. Compare this to the S&P/ASX Small Ordinaries and the MidCaps, in which the smaller size of the top 10 allows for greater representation elsewhere in the portfolio.
Table 3: Top 10 holdings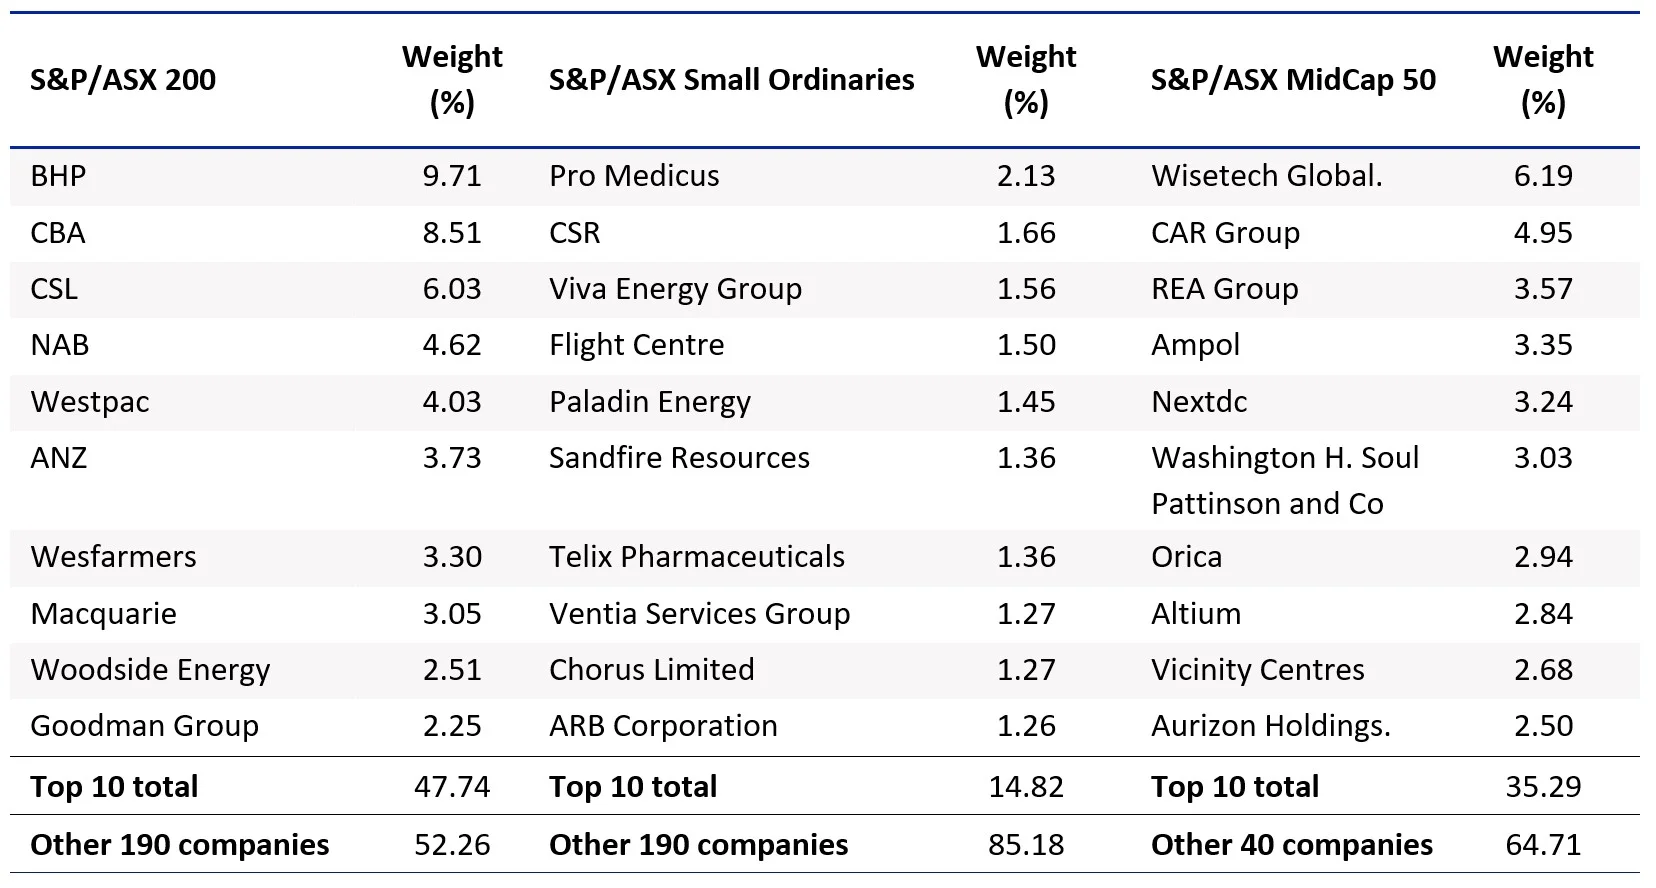
Source: FactSet, S&P, as at 29 February 2024
S&P/ASX Index Series – Sector allocation
The issue of concentration is also evident when you compare the sector allocation of each index. The S&P/ASX 200 and Small Ords each have over 30% allocated to just one sector, materials. The S&P/ASX MidCap 50 looks to have a better diversification as it has a better representation of all sectors, with no single sector being well over 20% of the index.
Chart 5: S&P/ASX 200 sector allocation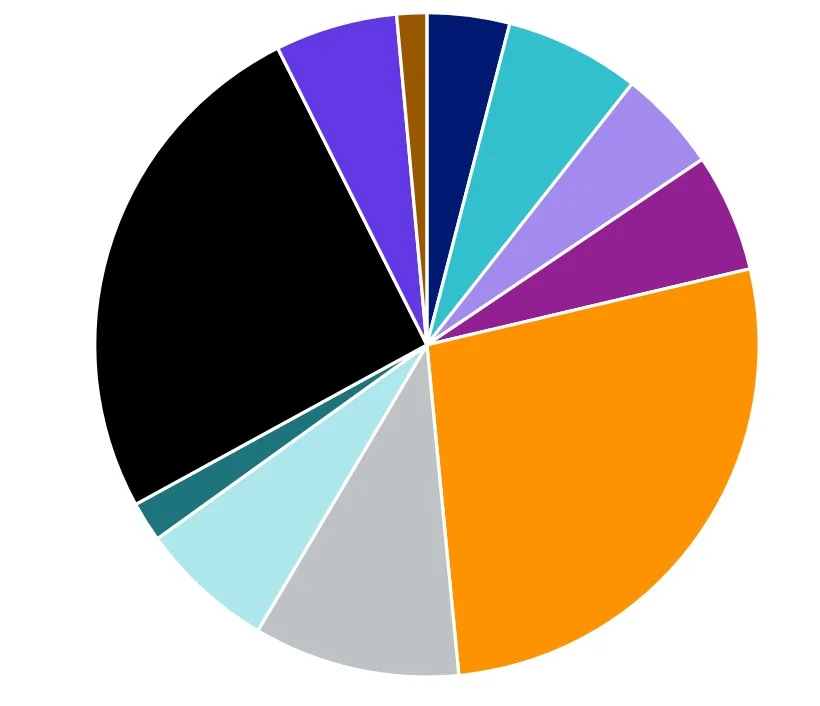
Chart 6: S&P/ASX Small Ordinaries sector allocation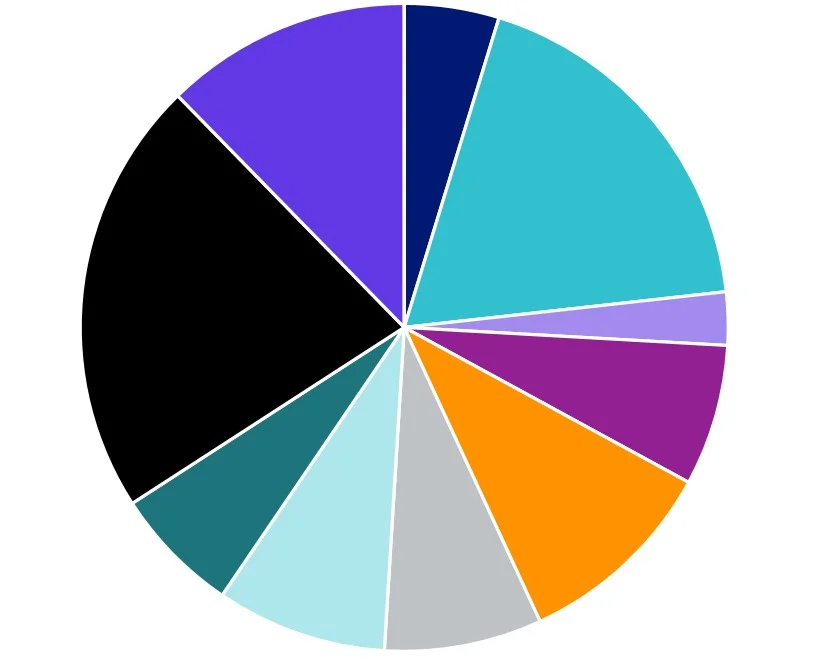
Source: Factset, 29 February 2024
Chart 7: S&P/ASX MidCap 50 sector allocation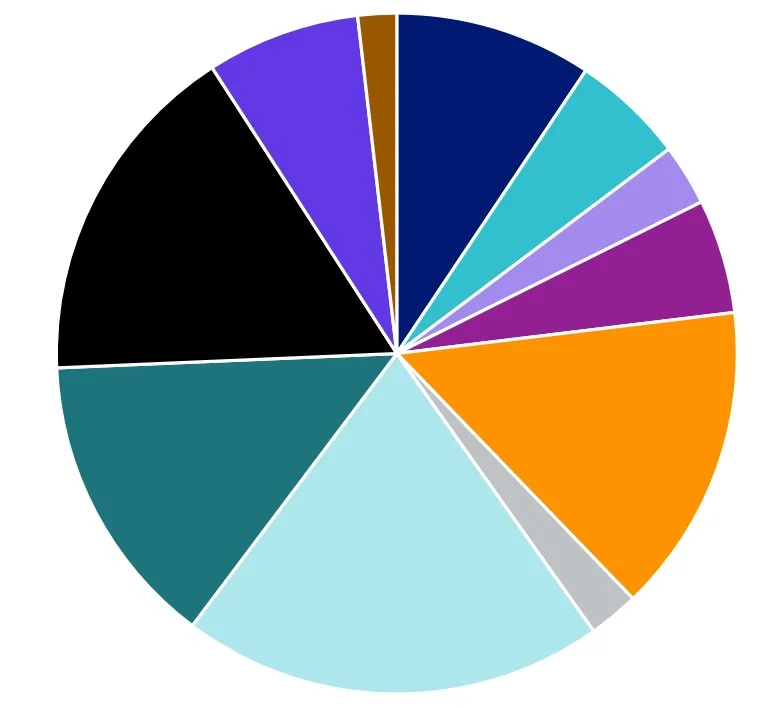
Source: Factset, 29 February 2024
While ETFs tracking each index have their merit for portfolio inclusion and you should assess all the risks and consider your investment objectives, the VanEck S&P/ASX MidCap ETF (ASX: MVE) is the only ETF listed on ASX which tracks the S&P/ASX MidCap 50 Index. Through one trade, investors can access a portfolio of 50 stocks and gain instant access to the ‘sweet spot’ of the Australian equity universe. As an ETF, MVE is cost-effective, liquid and transparent with holdings published daily. Past performance is no guarantee of future performance. The above is not a recommendation. Please speak to your financial adviser or stock broker.
Key risks
An investment in MVE carries risks associated with: financial markets generally, individual company management, industry sectors, stock and sector concentration, fund operations and tracking an index. See the PDS for details. No member of the VanEck group of companies guarantees the repayment of capital, the payment of income, performance, or any particular rate of return from any fund.


Published: 15 March 2024
Any views expressed are opinions of the author at the time of writing and is not a recommendation to act.
VanEck Investments Limited (ACN 146 596 116 AFSL 416755) (VanEck) is the issuer and responsible entity of all VanEck exchange traded funds (Funds) trading on the ASX. This is general advice only and does not take into account any person’s financial objectives, situation or needs. The product disclosure statement (PDS) and the target market determination (TMD) for all Funds are available at vaneck.com.au. You should consider whether or not an investment in any Fund is appropriate for you. Investments in a Fund involve risks associated with financial markets. These risks vary depending on a Fund’s investment objective. Refer to the applicable PDS and TMD for more details on risks. Investment returns and capital are not guaranteed.
The S&P/ASX MidCap Index (the Index”) is a product of S&P Dow Jones Indices LLC or its affiliates (“SPDJI”) and ASX Limited (“ASX”) and licensed for use by VanEck. S&P® is a registered trademark of Standard & Poor’s Financial Services LLC (“S&P”); Dow Jones® is a registered trademark of Dow Jones Trademark Holdings LLC (“Dow Jones”); and these trademarks have been licensed for use by SPDJI and sublicensed by VanEck. The Fund is not sponsored, endorsed, sold or promoted by SPDJI, Dow Jones, S&P, their respective affiliates, or ASX and none of them makes any representation regarding the advisability of investing in the Fund. Such parties do not accept liability for any errors, omissions, or interruptions of the Index and do not give any assurance that the Fund will accurately track the performance of the index or provide positive investment returns. Inclusion of a security within the index or Fund is not a recommendation by any party to buy, sell, or hold such security.