Banks losing interest
By the RBA’s own reckoning, a one percent rise in rates, if permanent could reduce the value of existing homes by 30%. This does not bode well for Australia’s banks that had been growing home-mortgage books on the back of record low rates. If you hold a blue-chip portfolio or are invested in an Australian equity fund that tracks or benchmarks to the S&P/ASX 200, one out of every five of your dollars is likely to be invested in the banks. There must be a better way.
Australian banks will continue to be tested in the new financial year. With the rising rate environment setting in and a subdued economic outlook, the big four banks’ margins could see continued deterioration.
Interest rate rises and the threat of more is weighing on the prices of bank shares. Investors are worried about the economic impact of aggressive rate rises, particularly on the mortgage market. By the RBA’s own reckoning, a one percent rise in rates, if permanent could reduce the value of existing homes by 30% and this does not bode well for Australia’s banks that had been growing home-mortgage books on the back of record low rates. A fall in the property market would adversely impact the big four lenders.
Most Australian equity portfolios have significant exposure to the big four banks which represent nearly 20% of the S&P/ASX 200 Accumulation Index. In other words, if you hold a blue-chip portfolio or are invested in an Australian equity fund that tracks or benchmarks to the S&P/ASX 200, one out of every five of your dollars is likely to be invested in the banks. Such sector bias makes sense if you are bullish the sector, but pressures on banks remain: earnings could weaken if there is an increase in non-performing loans, the major banks net interest margin (NIM) threatens to fall below 2% putting pressure on banks’ ability to generate cash flow and a slowdown in the macroeconomic conditions could suspend buybacks and/or put pressure on dividend growth.
With the RBA still committed to managing inflation and with a subdued economic outlook driven by falling property prices, VanEck Australian Equal Weight ETF (MVW) is a portfolio construction solution that reduces concentration risk to banks and can be deployed to de-risk and diversify with no one security or sector dominating providing a more balanced exposure to Australia’s economy.
The RBA is raising rates and it is impacting the housing market
Following last month’s decision by the RBA to increase the official cash-rate by 50 basis points, investors sold out of banks. “Property market fears wipe $46b off banks shares” was one headline in the Australian Financial Review. July’s policy meeting yesterday confirmed another rate hike of the same size, lifting the cash-rate to 1.35%. The problem of rate rises is (at least) two-fold for banks:
- Rate rises adversely impact property prices and in addition to the slowdown in new mortgages, there is a fear if property prices fall far enough there could be an increase in non-performing loans because they become more difficult to pay off; and
- Rising interest rates have the effect of slowing economic conditions which put further pressure on ability to increase or even maintain growth which puts pressure on dividends and buybacks.
Property prices
RBA’s own research (RDP 2019/01 Saunders and Tulip), suggests the orders of magnitude associated with its current rate rising policy are:
- a one-percentage point hike in rates, if permanent, or perceived to be permanent, would result in a 30% fall in house prices.
- if temporary, or assumed to be temporary, the result would be a 10% decline.
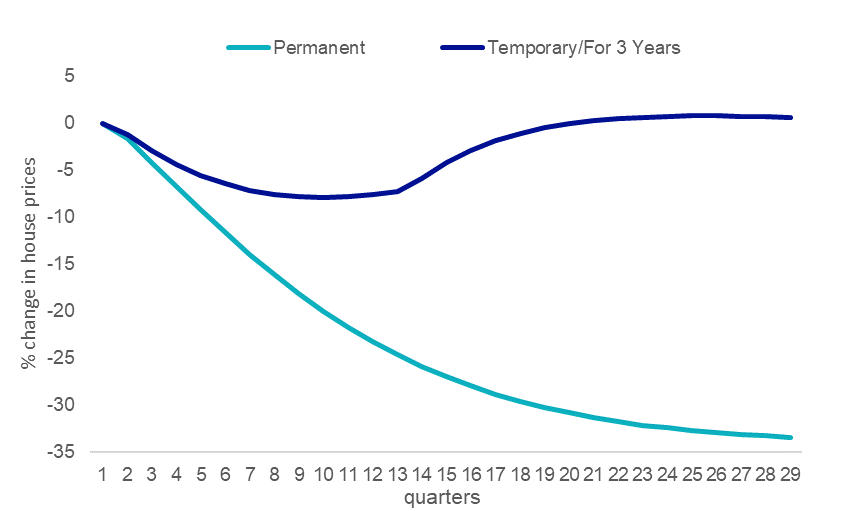
Source: RBA Research Discussion Paper – RDP 2019-01.
For years Australian banks have been able to grow their mortgage books as new home buyers looked to take advantage of record low rates. It now looks as though growth in new mortgages will slow. In addition, a fall in property prices is likely to put pressure on non-performing loans.
A weakening economy
The threat of rising rate and falling property prices is likely to have a negative impact on the Australian economy. You can see below that the Australian economy tends to correlate to the strength of the housing market. The chart shows the changes to dwelling investment and GDP over a year ago (oya).
Figure 2: The housing cycle generally correlates to the economic cycle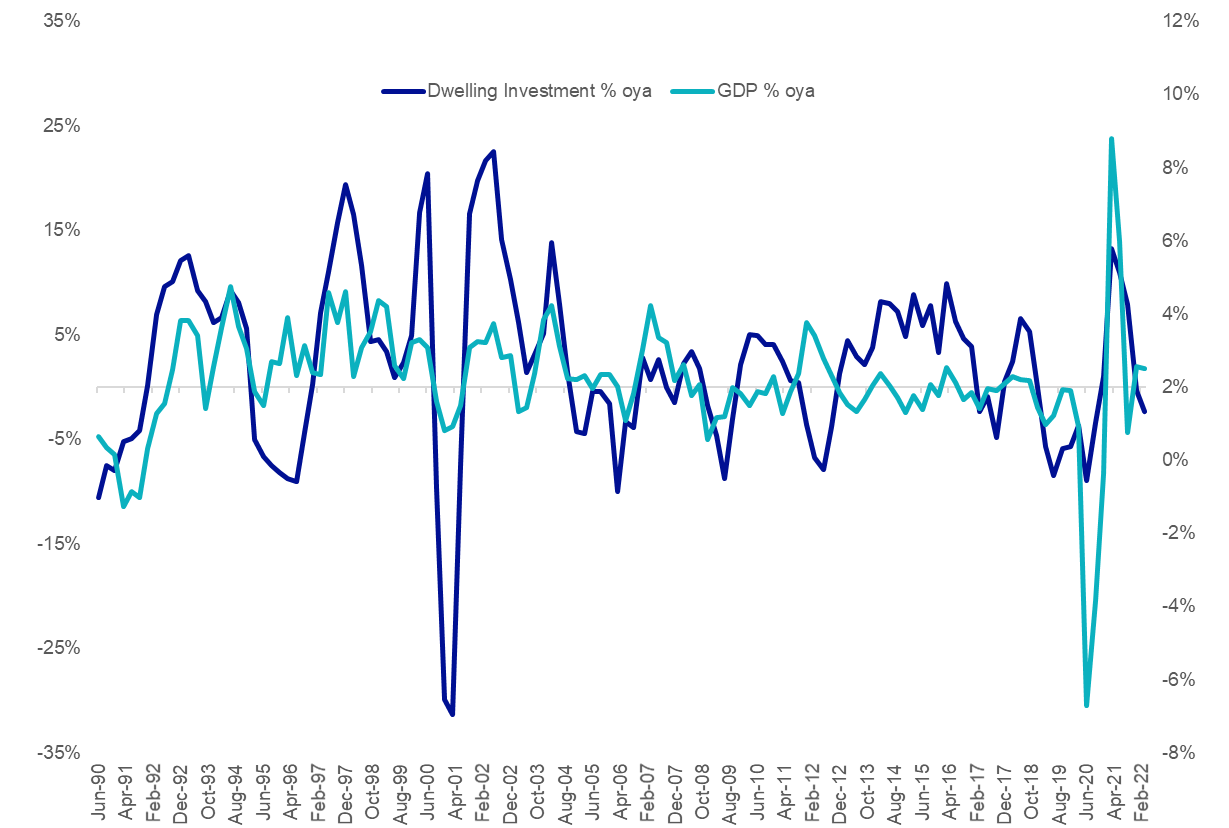
Source: ABS.
In the 2022/23 financial year Australian banks will be tested - again
Australian banks face continuing headwinds in 2022/23. With the rising rate environment driven RBA’s commitment to curb inflation, and a subdued economic outlook, the big four banks’ Net Interest Margins (NIMs) could see continued deterioration. The chart below shows that NIMS look set to dip below 2% for the first time (again, after a minor improvement last year). A reduction in NIMs results in a reduction in cash earnings and will impair the big four’s ability to increase dividend payments.
Figure 3: Major Banks’ Net Interest Margin* (Domestic, half yearly)
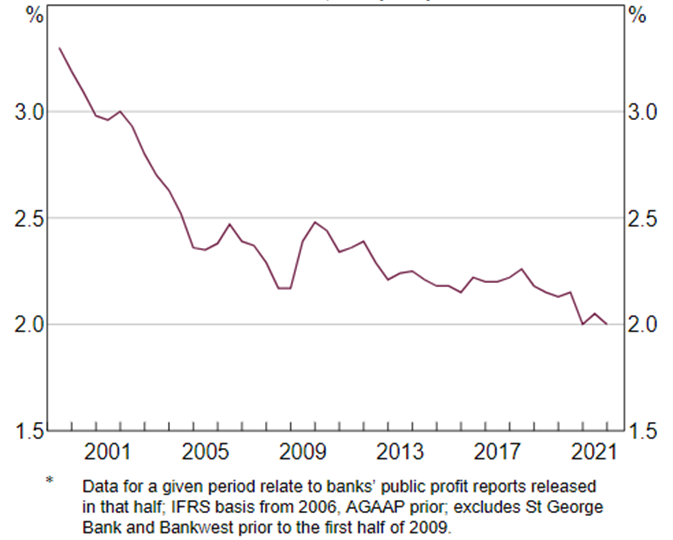
Sources: Banks’ financial reports; RBA. Data to 2 June 2022, released 8 June 2022.
This is problematic for bank shares and for the many Australian investors whose portfolios have significant exposure to the big four banks. The four pillars (CBA, Westpac, ANZ and NAB) represent a fifth of the S&P/ASX 200. That compares to MVW’s exposure to the big four banks of less than 5%. This dramatically reduces investors’ exposure to the big four, reducing concentration risk.
MVW vs S&P/ASX 200 Index – A more balanced approach
MVW equally weights the largest and most liquid stocks on the ASX at each rebalance. Because of this, at last rebalance, no company was more than 1.17%. What this means is that if ANZ or CBA goes up or down 2%, its impact on the S&P/ASX 200 is greater than on MVW.
On the other side of the coin, 70 companies within MVW have a higher weighting compared to the S&P/ASX 200 and therefore have greater influence on it. As the chart below shows, MVW has a larger exposure than that of the market capitalisation weighted benchmark index for around 80% of its portfolio. The companies in which MVW is overweight (relative to the S&P/ASX200) may be former small and mid-caps that have grown large, or they may be large or mega caps that have fallen in size. Importantly these companies have much greater potential for growth or are more likely to be taken over than the largest handful of stocks on ASX.
Figure 4: S&P/ASX 200 and MVW Index company weightings
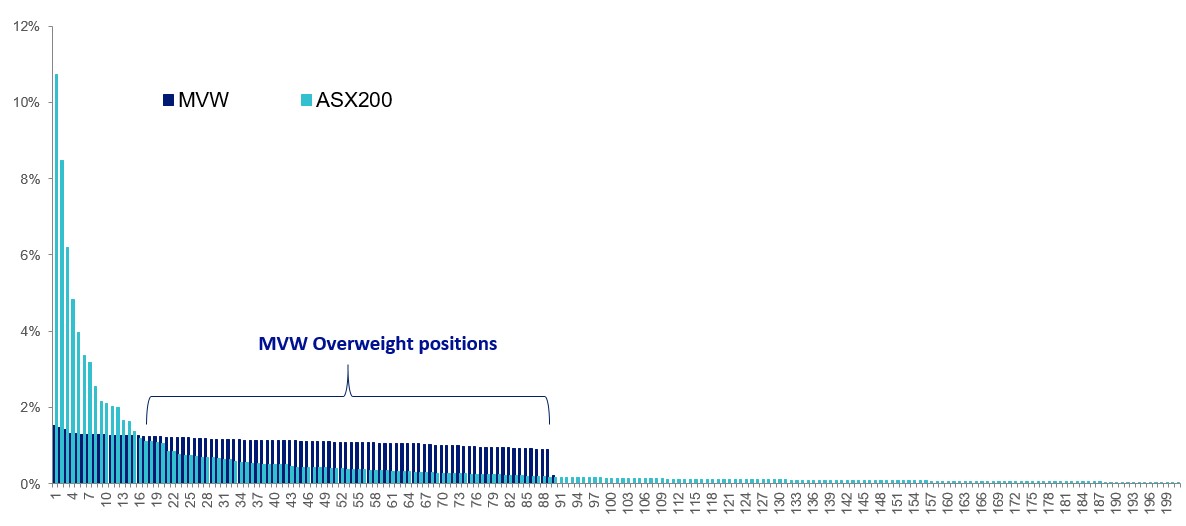
Source: VanEck, as at 31 May 2022
Another consequence of the equal weight methodology is that MVW relative to the S&P/ASX 200 is underweight those sectors that contain larger than average companies. For example, MVW is currently underweight the financials sector by 10.22% compared to the S&P/ASX 200. Conversely it will be overweight sectors that contain smaller than average companies. MVW is currently overweight industrials by 5.76% and consumer discretionary by 3.60%. Therefore, MVW has less sector concentration risk than the S&P/ASX 200.
Figure 5: S&P/ASX 200 and MVW sector weightings (%)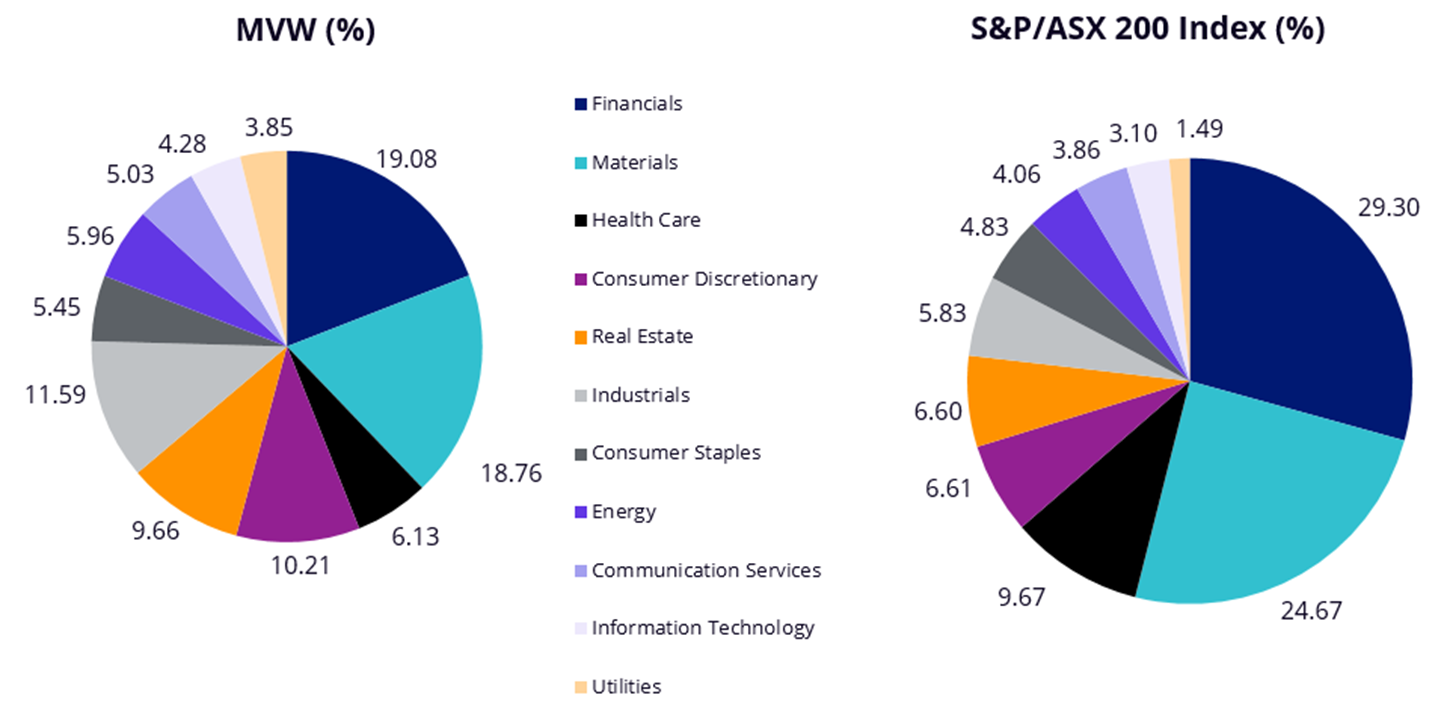
What this means is that if there is another systematic banking issue, or commodities fall the impact on the S&P/ASX 200 is greater than on MVW.
Key risks
An investment in the ETF carries risks. These include risks associated with financial markets generally, individual company management, industry sectors, fund operations and tracking an index. See the PDS for details.


Published: 08 July 2022
Any views expressed are opinions of the author at the time of writing and is not a recommendation to act.
VanEck Investments Limited (ACN 146 596 116 AFSL 416755) (VanEck) is the issuer and responsible entity of all VanEck exchange trades funds (Funds) listed on the ASX. This is general advice only and does not take into account any person’s financial objectives, situation or needs. The product disclosure statement (PDS) and the target market determination (TMD) for all Funds are available at vaneck.com.au. You should consider whether or not an investment in any Fund is appropriate for you. Investments in a Fund involve risks associated with financial markets. These risks vary depending on a Fund’s investment objective. Refer to the applicable PDS and TMD for more details on risks. Investment returns and capital are not guaranteed.
The S&P/ASX 200 Index is shown for comparison purposes as it is the widely recognised benchmark used to measure the performance of the broad Australian equities market. It includes the 200 largest ASX-listed companies, weighted by market capitalisation. MVW’s index measures the performance of the largest and most liquid ASX-listed companies, weighted equally at rebalance. MVW’s index has fewer companies and different industry allocations than the S&P/ASX 200.