The state of Australian banks and managing your ASX equities
Australia’s economy is hard to predict, with inflation and employment remaining high, but a slowdown predicted as the RBA’s recent hiking cycle impacts households.
Despite some grim economic forecasts, the share prices of Australian banks have performed well over the past three months, CBA for example, recently hit an all-time high of $115.98 per share.
This has been surprising, given banks typically underperform as the economy starts to slow and future rate-hike expectations fall. Valuations have now come to the fore, Australian banks, on a global basis are the most expensive in the developed world on a 12-month forward price-to-earnings and price-to-book basis.
Should valuations move to be in line with global valuations and thus better reflect the economic outlook, it could disproportionately impact many Australian portfolios, especially those that track or are benchmarked to the S&P/ASX 200 which we have noted before is concentrated to banks which make up over 20% of the Australian benchmark index. Such sector bias makes sense if you are bullish on the sector but given the well-noted pressures on banks remain: margins are under pressure, the economic outlook is not conducive to growth and defaults are expected to rise, we think a more balanced approach to Australian equites may be prudent into 2024.
VanEck Australian Equal Weight ETF (MVW) is a portfolio construction solution that reduces concentration risk to banks and can be deployed to de-risk and diversify with no one security or sector dominating providing a more balanced exposure to Australia’s economy.
Australian bank valuations stretched
Australian bank shares, notably CBA, have performed well over the past three months. CBA’s share price rose above $115 last week and we think this movement is puzzling given banks typically underperform when interest rate expectations fall and that has been the rate environment into the end of 2023.
The graph below compares the performance of Australian banks relative to the S&P/ASX 200 versus 10-year government bond yield. When the dark blue line is rising, Australian banks are outperforming the S&P/ASX 200.
While Australia’s prospects for a soft landing have improved for 2024, the market seems to be pricing a dream scenario for the banks despite the risks of increased mortgage stress in a prolonged higher interest rate environment. It was also only a few months ago that banks were consumed by a mortgage price war.
Chart 1: Australian banks' performance relative to the S&P/ASX 200 versus 10-year government bond yield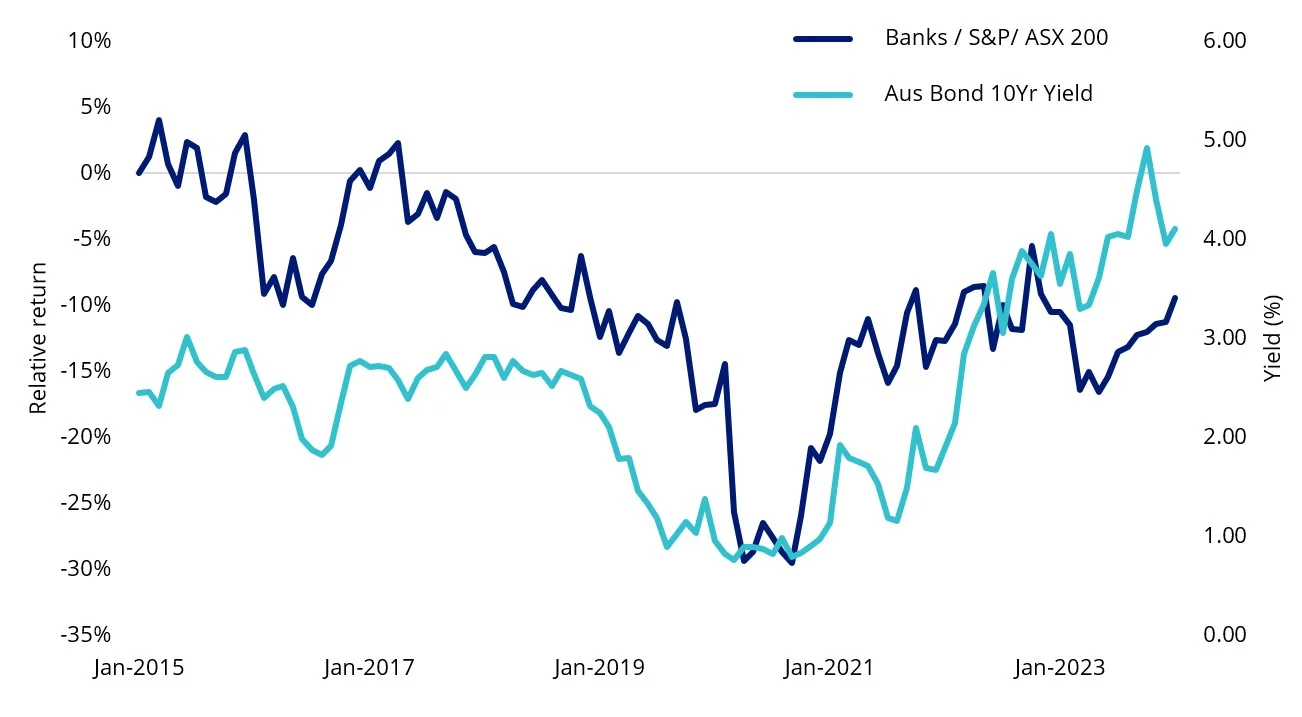
Source: Bloomberg, Banks is MVIS Australian Banks Index. You cannot invest in an index. Past performance is not indicative of future performance.
The rally in bank prices has stretched their valuations. Australia’s banks when compared globally are also the most expensive in the developed world by 12-month forward price to earnings and price to book.
Chart 2: Global bank valuations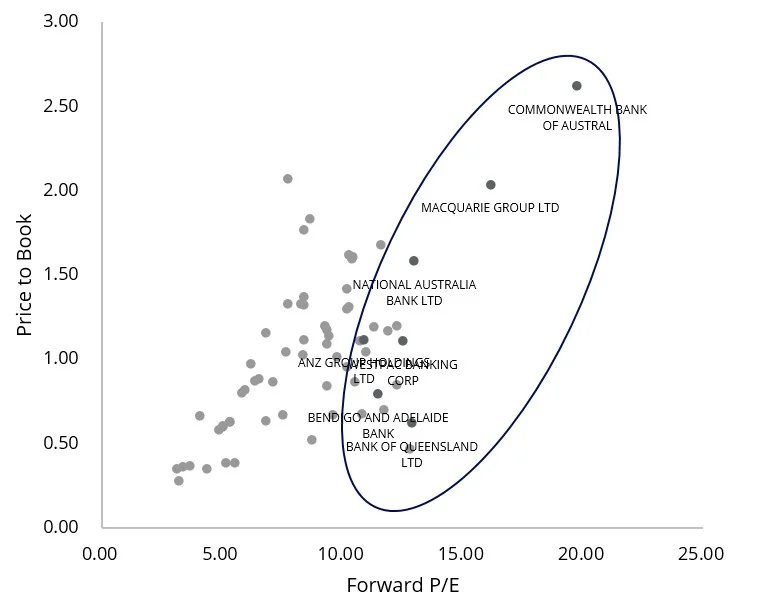
Source: Bloomberg, as at 18 January 2024.
Many sell-side analysts now have CBA as a ‘sell’ recommendation.
Chart 3: CBA sell-side price recommendations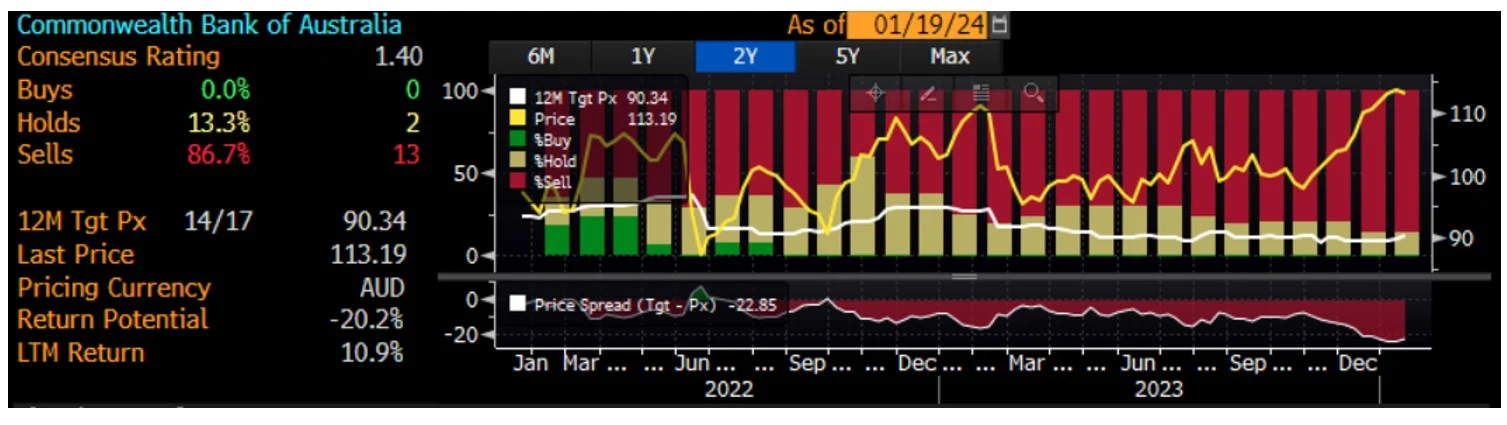
Source: Bloomberg, as at 18 January 2024
This is not only a CBA story. Each of Australia’s ‘Big 4’ banks face continuing headwinds in 2024. A subdued economic outlook and potential RBA rate cuts could see the Big 4 banks’ Net Interest Margins (NIMs) continue to deteriorate. The chart below shows that while NIMs rose as rates went up last year they have dipped below 2% again. A reduction in NIMs results in a reduction in cash earnings and will impair the Big 4’s ability to increase dividend payments.
Chart 4: Major Banks’ NIM* (Domestic, half yearly)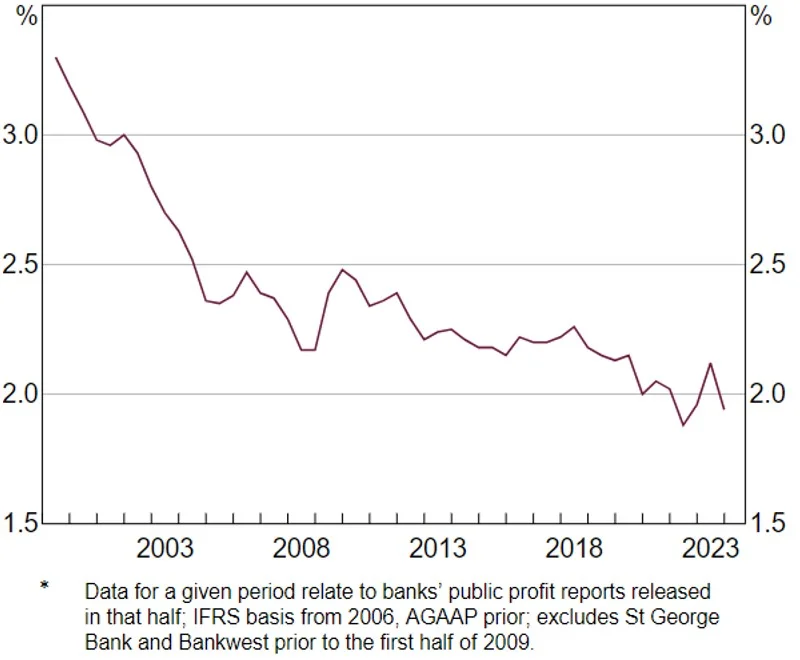
The case for MVW: Core Australian equity exposure and underweight banks
Investors concerned about an overexposed portfolio position to Australia’s banks should consider VanEck Australian Equal Weight ETF (MVW). The index MVW tracks equally weights the largest and most liquid stocks on the ASX at each rebalance. A consequence of the equal weight methodology is that MVW relative to the S&P/ASX 200 is underweight those sectors that contain larger than average companies. For example, MVW is currently underweight the banking sector by 13.73% compared to the S&P/ASX 200. Conversely, it will be overweight sectors that contain smaller than average companies. MVW is currently overweight industrials by 8.49%, real estate by 5.18% and information technology by 1.47%. Therefore, MVW has less sector concentration risk than the S&P/ASX 200.
Chart 5: MVW and S&P/ASX 200 sector weightings (%)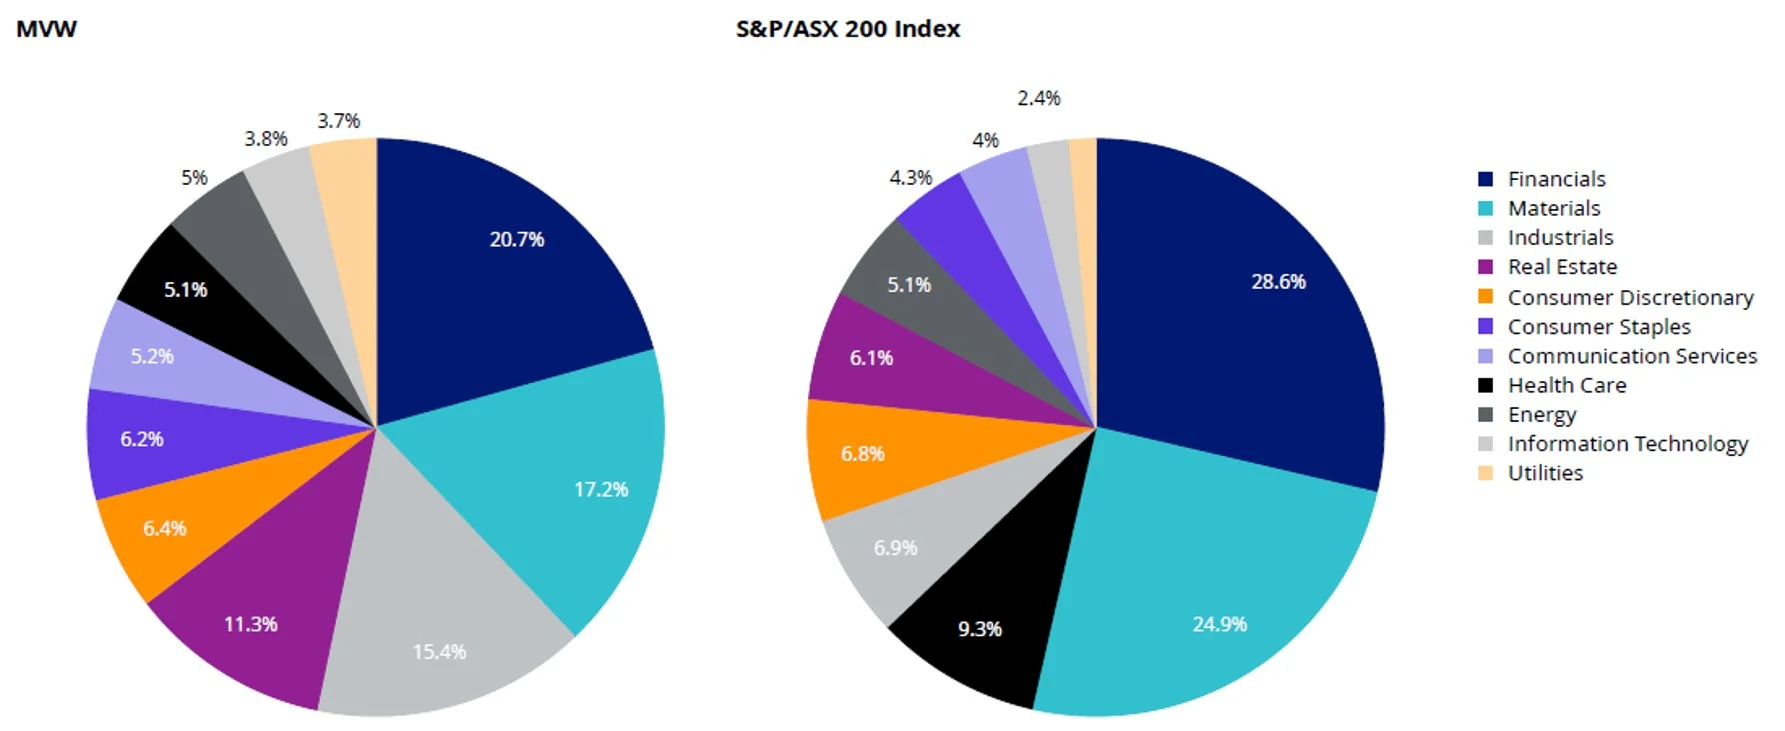
MVW is trading at a lower 12-month forward price to earnings and offers a higher price target consensus return than the S&P/ASX 200.
Chart 6: 12-month forward price to earnings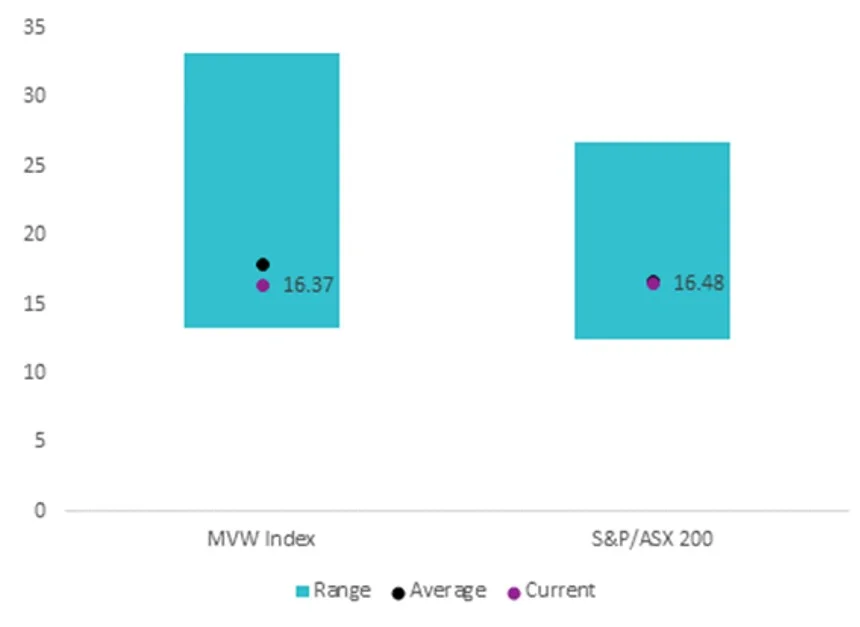
Source: Bloomberg, as at 18 January 2024.
Chart 7: 12-month price target return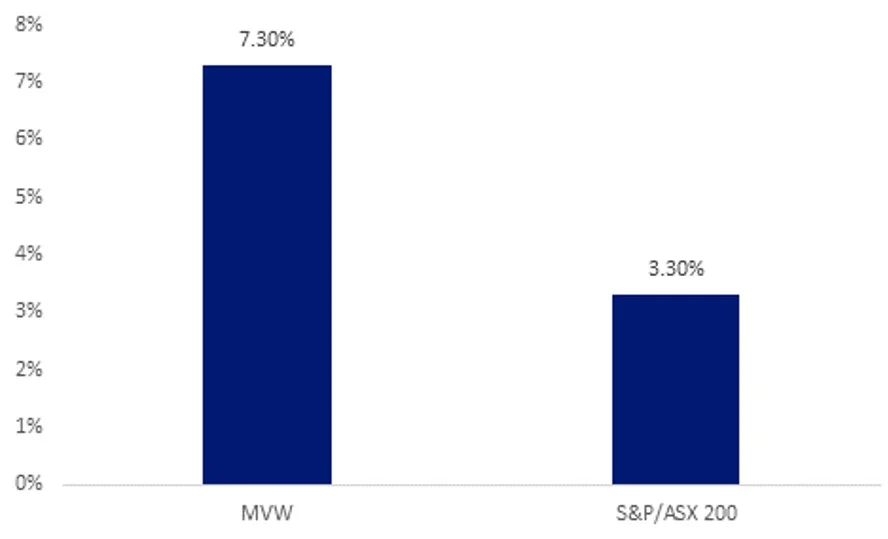
Source: Bloomberg consensus, as at 18 January 2024. This is not a recommendation to act. Future performance may differ. You cannot invest in an index.


Published: 02 February 2024
Key risks: An investment in the ETF carries risks. These include risks associated with financial markets generally, individual company management, industry sectors, fund operations and tracking an index. See the PDS for details.
*For more information on the Herfindahl Index click here.
Any views expressed are opinions of the author at the time of writing and is not a recommendation to act.
VanEck Investments Limited (ACN 146 596 116 AFSL 416755) (VanEck) is the issuer and responsible entity of all VanEck exchange traded funds (Funds) trading on the ASX. This is general advice only and does not take into account any person’s financial objectives, situation or needs. The product disclosure statement (PDS) and the target market determination (TMD) for all Funds are available at vaneck.com.au. You should consider whether or not an investment in any Fund is appropriate for you. Investments in a Fund involve risks associated with financial markets. These risks vary depending on a Fund’s investment objective. Refer to the applicable PDS and TMD for more details on risks. Investment returns and capital are not guaranteed.