The sweet spot of the ASX Index series
At the turn of the century, the S&P and the ASX launched its S&P/ASX index series. Subsequently, ETFs have been launched that track these indices and ETFs on ASX have proliferated. Since the year 2000, the market has changed, as has investor demands. Here we provide some insight, comparing the market capitalisation indices that make up the S&P/ASX series: S&P/ASX 200, S&P/ASX 50, S&P/ASX MidCap 50, S&P/ASX Small Ordinaries Index and the newer market capitalisation index, the S&P/ASX 300 ex S&P/ASX 20 Index. The results may surprise you.
According to S&P, “Since its debut in April 2000, the S&P/ASX Index Series has helped to define the Australian equity market. As Australia’s most widely followed market indicator, the S&P/ASX 200 serves as the de facto measure of the value and performance of the nation’s stock market. Market peaks and valleys are defined by the level of the S&P/ASX 200.” April 2000 also marked the introduction of other size segment indices too, the S&P/ASX 50, S&P/ASX Small Ordinaries, and S&P/ASX MidCap 50.
Investing and the Australian market has changed since the year 2000.
In July 2013, in response to investor demand, S&P launched the S&P/ASX 300 ex S&P/ASX 20 Index. The index gave active managers a new benchmark to measure performance by excluding the part of the market they felt was fully researched and they could not add value. This is because the way many active managers construct their portfolios is to hold positions similar to the index they are aiming to beat, otherwise they are taking on a big risk. They will be overweight companies they like and be underweight companies they don’t like, but within a prescribed range. The S&P/ASX 200 is dominated by a handful of mega-cap stocks and the top 20 represents over 60% of that index.
More exposure to mid-caps
This new index allowed active funds to exclude the mega-caps of the top 20, but still invest in sizeable companies. These new funds were different from a small companies portfolio, benchmarked to the S&P/ASX Small Ordinaries (Small Ords) Index. The Small Ords excludes the largest 100 companies on ASX.
The new S&P/ASX 300 ex S&P/ASX 20 Index allowed for investing in mid-caps.
The sweet spot of Australian equity investing
Mid-caps offer the best of both small and mega-caps. They represent a mix of established and still developing companies and a balance between the spirit and youth of small-caps and the stability of large-companies.
Some of the best-known large-caps started as small-caps then grew to be titans of their industry. Finding a hidden gem is one of the greatest potential benefits of investing in small companies but it also comes with a lot more risk because they can fail spectacularly.
At the other end of the spectrum, mega-caps have more stability than mid or small-caps because of their size. Because of this, they are often less agile than their mid-and small-cap peers.
There is a reason the smartest fund managers in the country wanted to include more Australian mid-caps in their portfolios.
Since their launch, the S&P/ASX MidCap 50 index has outperformed both Australian large-and small-caps and the broad S&P/ASX 200 benchmarks.
Chart 1: Performance April 2000 to March 2023
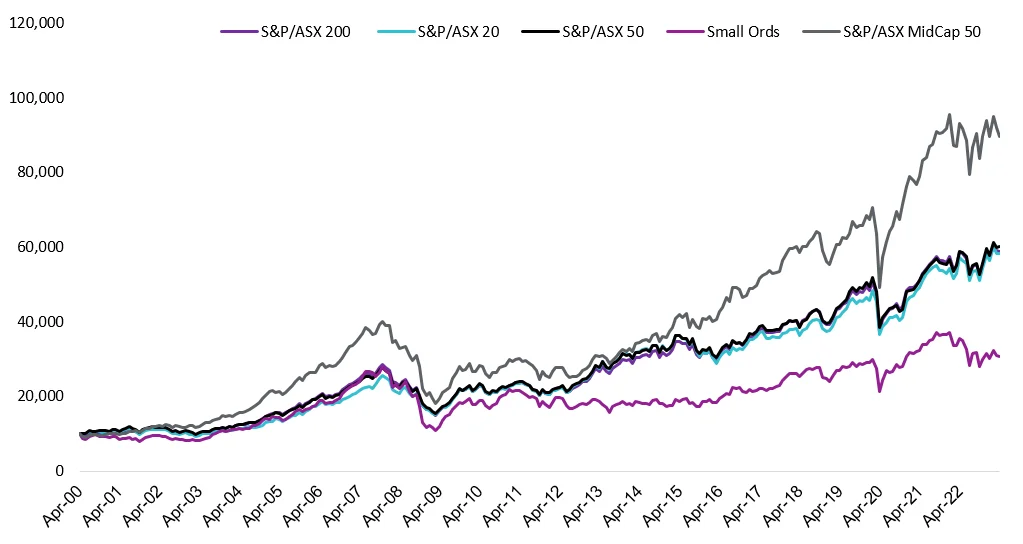
Source: VanEck, Morningstar, since inception of S&P/ASX index series (4 April 2000) to 31 March 2023. Rebased to 10,000. Results are calculated to the last business day of the month and assume immediate reinvestment of all dividends and exclude costs associated with investing in MVE. You cannot invest directly in an index. Past performance is not a reliable indicator of future performance
Since the launch of the S&P/ASX 300 ex S&P/ASX 20 Index, MidCaps have been the winner, still.
Chart 2: Performance July 2013 to March 2023
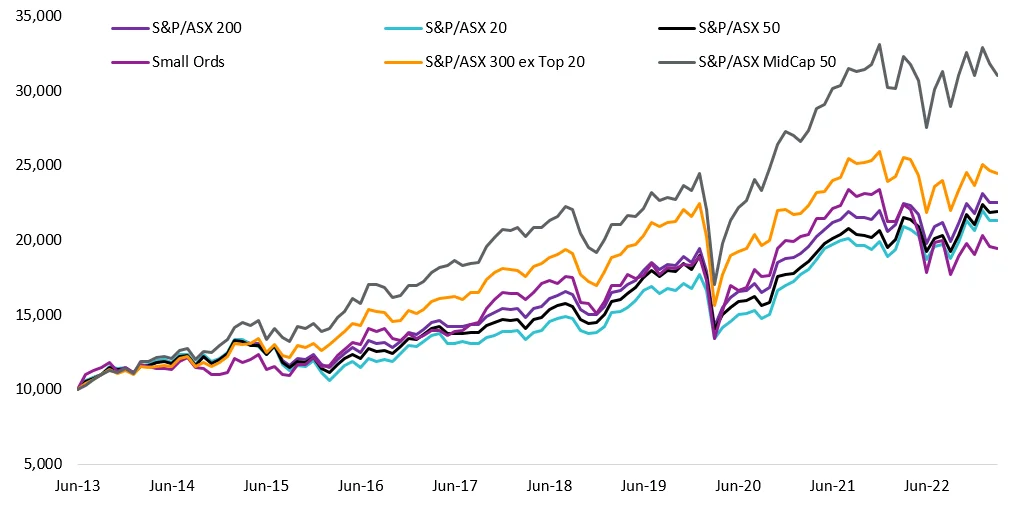
Source: VanEck, Morningstar, since inception of S&P/ASX 300 ex S&P/ASX 20 Index (1 July 2013) to 31 March 2023. Rebased to 10,000. Results are calculated to the last business day of the month and assume immediate reinvestment of all dividends and exclude costs associated with investing in MVE. You cannot invest directly in an index. Past performance is not a reliable indicator of future performance
Mid-caps sit in the ‘sweet spot’ between large- and small companies. This is the reason active managers tend to want more of their portfolios exposed to these companies.
Considering returns and risks
The following table shows the trailing performance of the S&P/ASX MidCap 50 Index in comparison to other key S&P/ASX indices to 31 March 2023. The S&P/ASX MidCap 50 Index delivered the best performance over 3, 10 and 20-year periods.
Table 1: Trailing returns of the S&P/ASX index series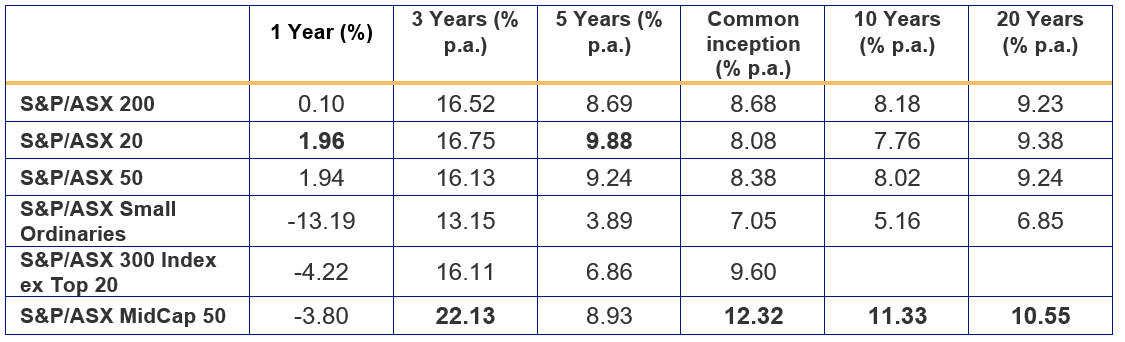
Source: VanEck, Morningstar, as at 31 March 2023.Common inception is launch date of &P/ASX 300 ex S&P/ASX 20 Index (1 July 2013). Results are calculated to the last business day of the month and assume immediate reinvestment of all dividends and exclude costs associated with investing in MVE. You cannot invest directly in an index. Past performance is not a reliable indicator of future performance.
Investors may worry this return might come with too much risk. The Sharpe ratio combines the return measure with a volatility (risk) measure to quantify the relationship between the returns and risk. The greater the value of the Sharpe ratio, the better the risk adjusted return. The table below shows that the S&P/ASX MidCap 50 Index has delivered the best risk-adjusted returns over 10 and 20 years.
Table 2: Sharpe ratio of the S&P/ASX index series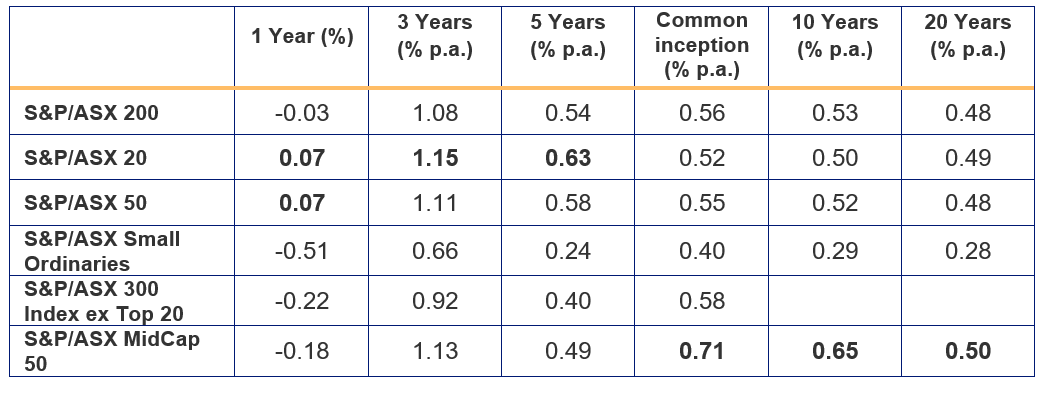
Source: VanEck, Morningstar, as at 31 March 2023.Common inception is launch date of &P/ASX 300 ex S&P/ASX 20 Index (1 July 2013). Results are calculated to the last business day of the month and assume immediate reinvestment of all dividends and exclude costs associated with investing in MVE. You cannot invest directly in an index. Past performance is not a reliable indicator of future performance.
Let’s walk through some of the other differences between the indices.
S&P/ASX Index Series - Top 10 holdings
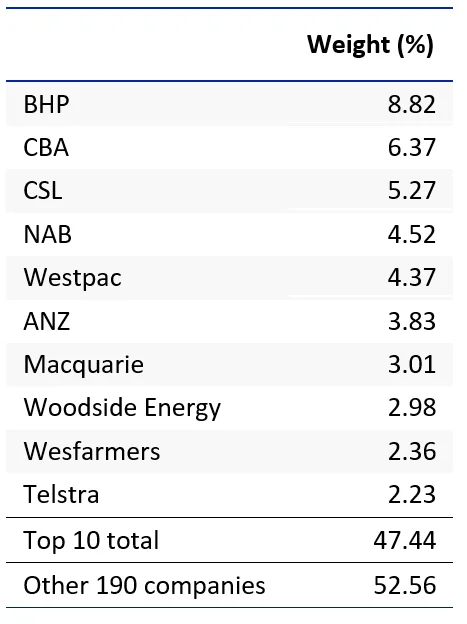
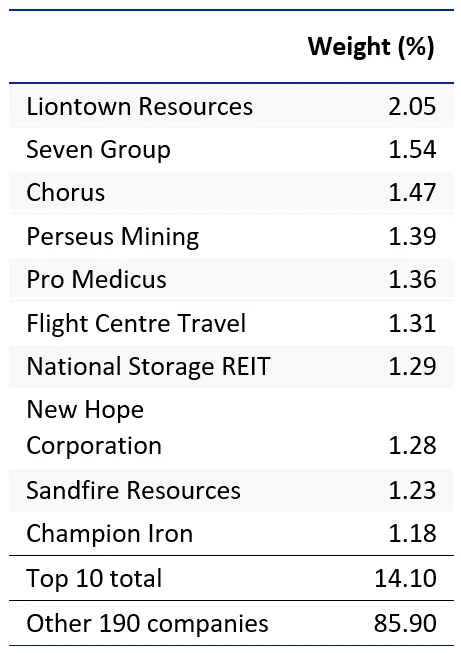
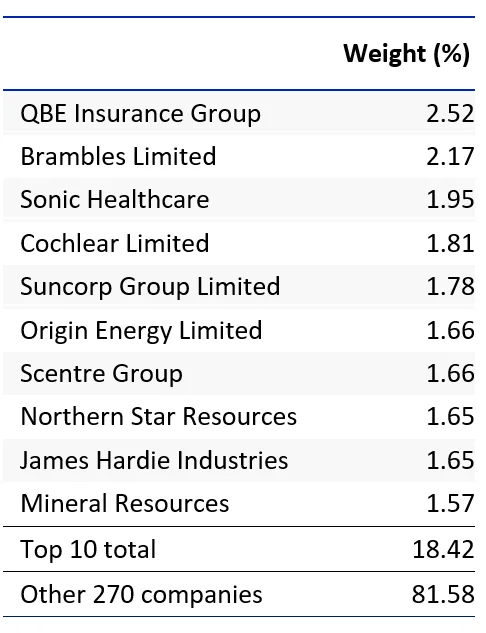
Below you can see the top 10 companies of each index. In the S&P/ASX 200 many stocks have more than 5% individual exposure. The top 10 make up over 45% of the index. Investors seeking diversification from a portfolio of 200 or 50 stocks would not expect concentration. In these indices, the small sized companies outside of the top 10 would not have much impact on performance. Compare this to the S&P/ASX Small Ordinaries and the MidCaps, in which the smaller size of the top 10 allows for greater representation elsewhere in the portfolio.
| Table 3: Top 10 holdings S&P/ASX 200 |
Table 4: Top 10 holdings S&P/ASX Small Ordinaries |
 |
 |
| Table 5: Top 10 holdings S&P/ASX 300 Index ex Top 20 |
Table 6: Top 10 holdings S&P/ASX MidCap 50 |
 |
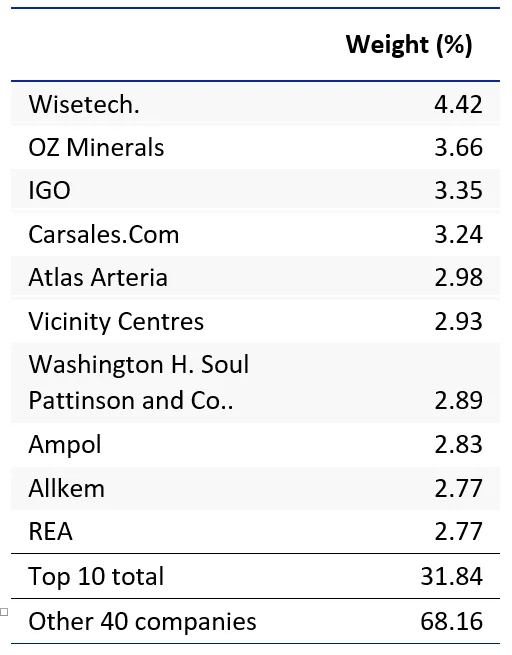 |
Source for tables 3-6: FactSet, S&P, as at 31 March 2023
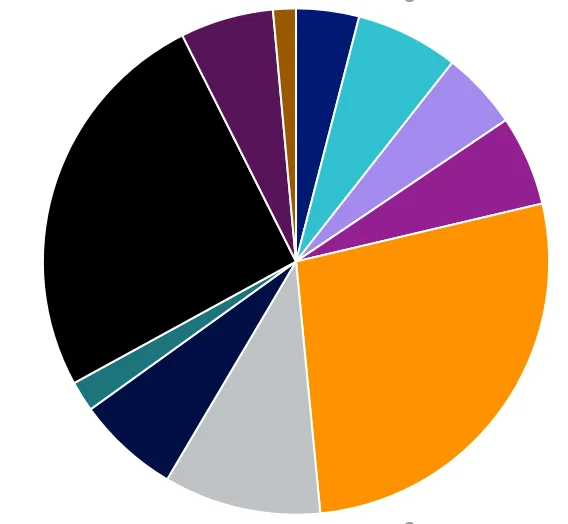
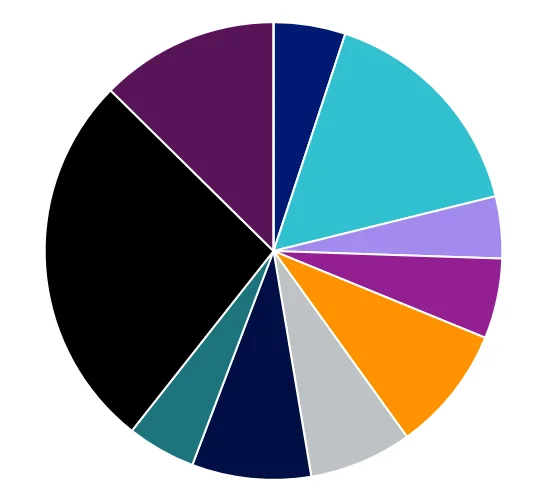
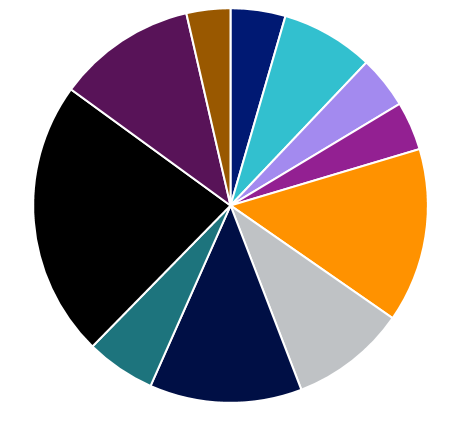
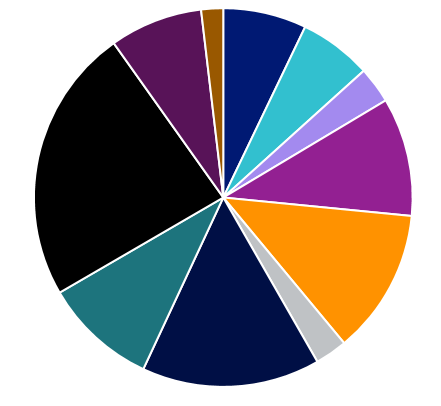
S&P/ASX Index Series – Sector allocation
|
Chart 3: S&P/ASX 200 sector allocation |
Chart 4: S&P/ASX Small Ordinaries sector allocation |
 |
 |
| Chart 5: S&P/ASX 300 Index ex Top 20 allocation | Chart 6: S&P/ASX MidCap 50 sector allocation |
 |
 |
Source for charts 3-6: Factset, 31 March 2023
The issue of concentration is also evident when you compare the sector allocation of each index. The S&P/ASX 200 and Small Ords each have over 30% allocated to just one sector, materials. Both the S&P/ASX 300 Index ex Top 20 allocation and the S&P/ASX MidCap 50 look to have a better diversification as they have better representations of sectors.
While ETFs tracking each index has its merit for portfolio inclusion and you should assess all the risks and consider your investment objectives, the VanEck S&P/ASX MidCap ETF (ASX: MVE) is the only ETF listed on ASX which tracks the S&P/ASX MidCap 50 Index. Through one trade, investors can access a portfolio of 50 stocks and gain instant access to the ‘sweet spot’ of the Australian equity universe. As an ETF, MVE is cost effective, liquid and transparent with holdings published daily.
Past performance is no guarantee of future performance. The above is not a recommendation. Please speak to your financial adviser or stock broker.
Learn more about ETF investing with VanEck Australia.
Key risks
An investment in MVE carries risks associated with: financial markets generally, individual company management, industry sectors, stock and sector concentration, fund operations and tracking an index. See the PDS for details. No member of the VanEck group of companies guarantees the repayment of capital, the payment of income, performance, or any particular rate of return from any fund.


Published: 01 May 2023
VanEck Investments Limited ACN 146 596 116 AFSL 416755 (‘VanEck’) is the responsible entity and issuer of units in the VanEck S&P/ASX MidCap ETF. This is general advice only, not personal financial advice. It does not take into account any person’s individual objectives, financial situation or needs. Read the PDS and speak with a financial adviser to determine if the fund is appropriate for your circumstances. The PDS is available here. The Target Market Determination is available here.
No member of the VanEck group of companies guarantees the repayment of capital, the payment of income, performance, or any particular rate of return from any fund.
The S&P/ASX MidCap Index (the Index”) is a product of S&P Dow Jones Indices LLC or its affiliates (“SPDJI”) and ASX Limited (“ASX”) and licensed for use by VanEck. S&P® is a registered trademark of Standard & Poor’s Financial Services LLC (“S&P”); Dow Jones® is a registered trademark of Dow Jones Trademark Holdings LLC (“Dow Jones”); and these trademarks have been licensed for use by SPDJI and sublicensed by VanEck. The Fund is not sponsored, endorsed, sold or promoted by SPDJI, Dow Jones, S&P, their respective affiliates, or ASX and none of them makes any representation regarding the advisability of investing in the Fund. Such parties do not accept liability for any errors, omissions, or interruptions of the Index and do not give any assurance that the Fund will accurately track the performance of the index or provide positive investment returns. Inclusion of a security within the index or Fund is not a recommendation by any party to buy, sell, or hold such security.