A ‘value’ opportunity hiding in plain sight
While many equity investors are worried about valuations in some markets, the local bourse however looks to be an opportunity.
On a historical basis, the Australian equity market looks to be better positioned to provide growth than its global counterparts. But it pays to be selective, those sectors that face headwinds, are the sectors Australian investors are overweight.
Finding value in equities
The cyclically adjusted price-earnings ratio (CAPE) for the S&P 500 is currently around 31x, which is 30% higher than its historical long-term average. Driven higher by the market’s recent rise, the value of the US market has many investors wary. But that shouldn’t mean equity investors should stop looking for opportunities.
With many pundits predicting a soft landing and that rates will be falling at the end of the year, sitting on the sidelines may not be optimal. Monetary policy loosening such as rate cuts are historically associated with stronger equity returns.
Australia’s CAPE ratio is currently around 18x which is 5% below its long-term average. The local market, we think, presents a value opportunity relative to the biggest equities market in the world.
Chart 1: Historical CAPE ratio, S&P 500 and S&P/ASX 200
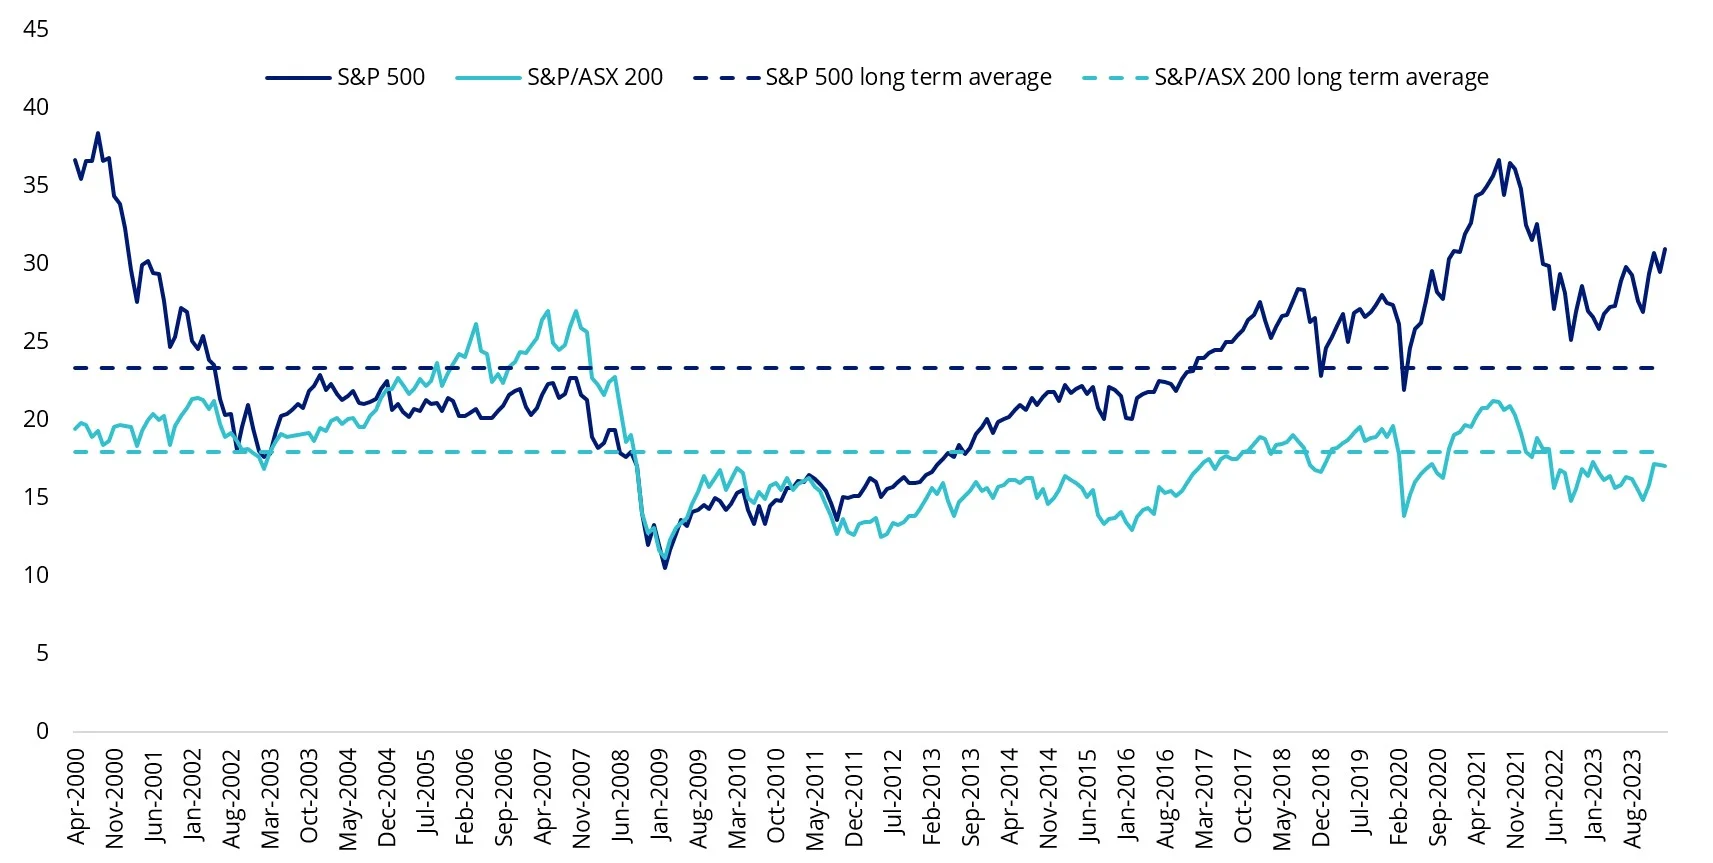
Source: Bloomberg, VanEck, S&P, to end of February 2024.
But as usual, with Australian equities, we caution that it may be prudent to take a different approach.
The recent stronger-than-expected results during the recent Australian equities reporting season had analysts revising their price targets.
Chart 2: 2024 Price target revisions
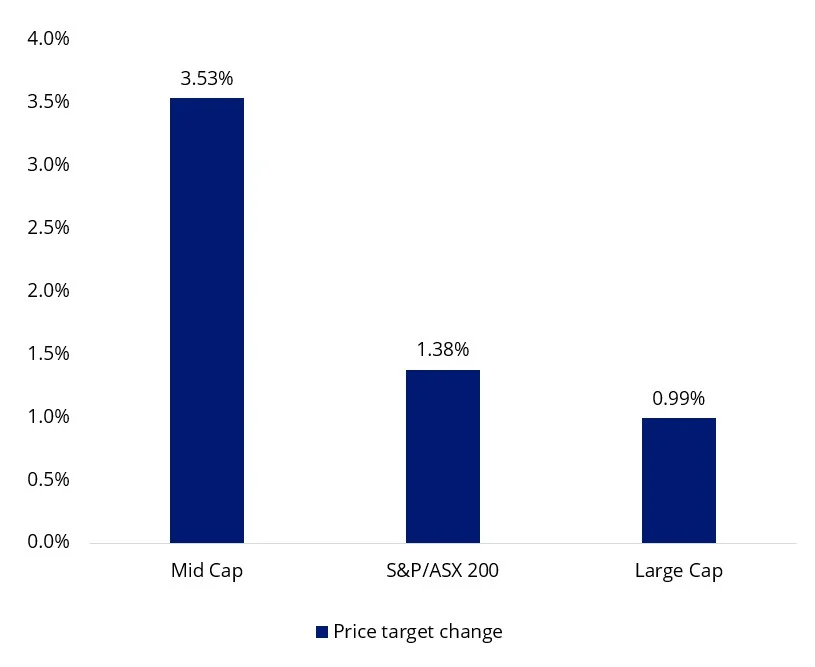
Source: FactSet, 6 March 2024, Large Cap as S&P/ASX 20, Mid cap is S&P/ASX MidCap 50.
Mid-caps recorded the highest average upward price target revision compared to the large-caps and the broader Australian equities market. Looking further ahead, estimated 3 to 5 years earnings per share (EPS) growth shows a similar story.
Chart 3: Estimated 3 to 5 years earnings (EPS) per share growth
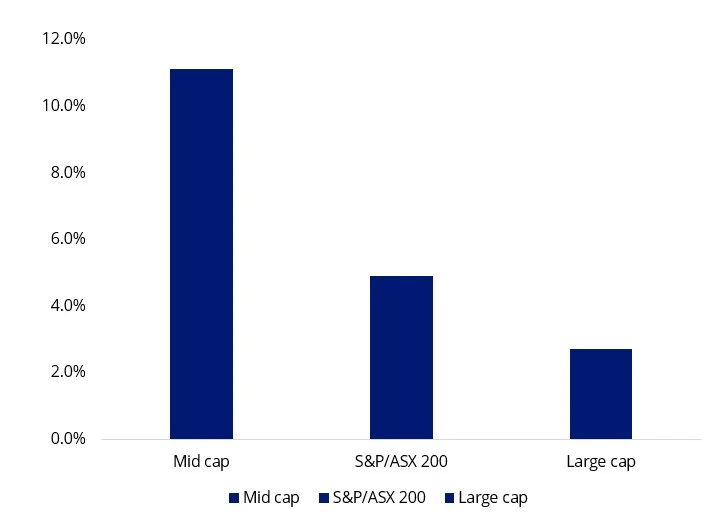
Source: FactSet, 6 March 2024, Large Cap as S&P/ASX 20, Mid cap is S&P/ASX MidCap 50.
Much of the commentary in the press, after the reporting season, has been about the outlook for mega-cap bank shares. And that has not been good:
- According to the Australian: “It’s overvalued’: CBA defies the sceptics to hit record $121.54”
- Similarly, SMH ran with this headline: “Hard to fathom’: analysts wary of surge in bank shares”
- On 14 March the AFR went further: “Macquarie says it’s time to sell the big four banks”
It would make sense therefore for Australian equity funds to have more exposure away from these mega-caps. However, because most Australian equity portfolios, passive and active, are linked to the S&P/ASX 200 Index these portfolios are likely to have more significant exposure to mega-caps, including the big 4 than the mid-caps that are primed for growth.
We think Australian equities may be about to break out, but value in the mega caps is weighing down the market. The price to earnings (P/E) ratio of the mega-cap dominated S&P/ASX 20 is higher than its historical average. Meanwhile, the P/E of mid caps is lower than its historical average. So, if you have conviction in a positive return profile for Australian equities, like we do, investors willing to take on additional risk may gear their exposure, but we think, the exposure should not be concentrated to Australian mega-caps.
Chart 4: S&P/ASX 200
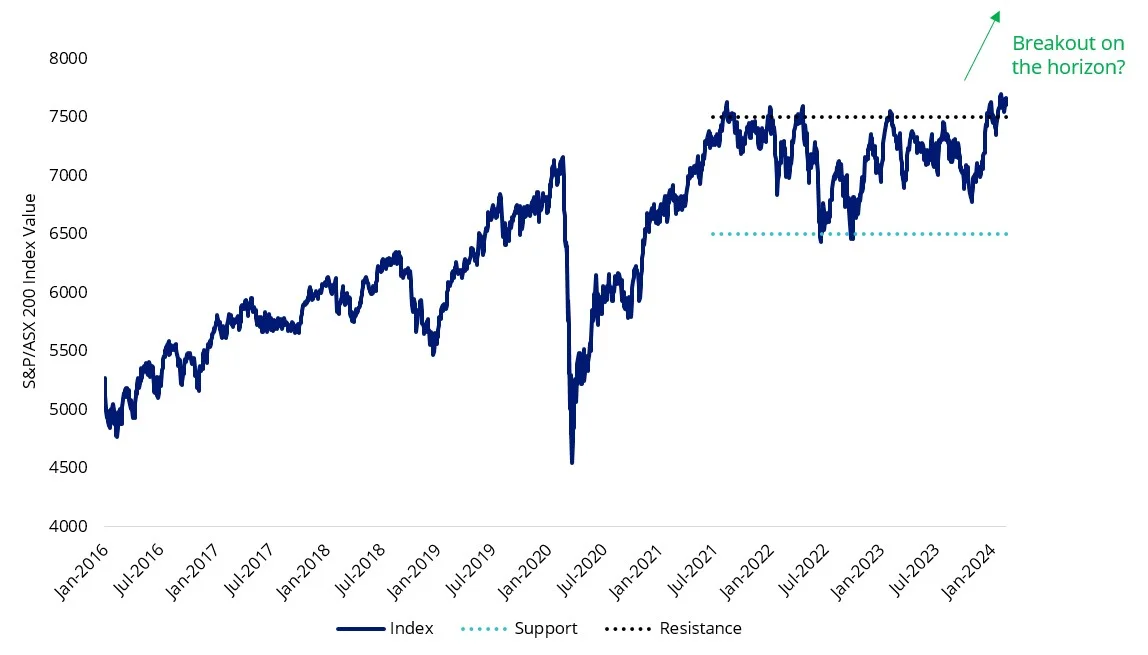
Source: Bloomberg. 1 April 2014 to 29 February 2024. This is a forecast and is not guaranteed to occur.
Chart 5: Price to 12m forward earnings (PE ratio) - Equal weight below historical average
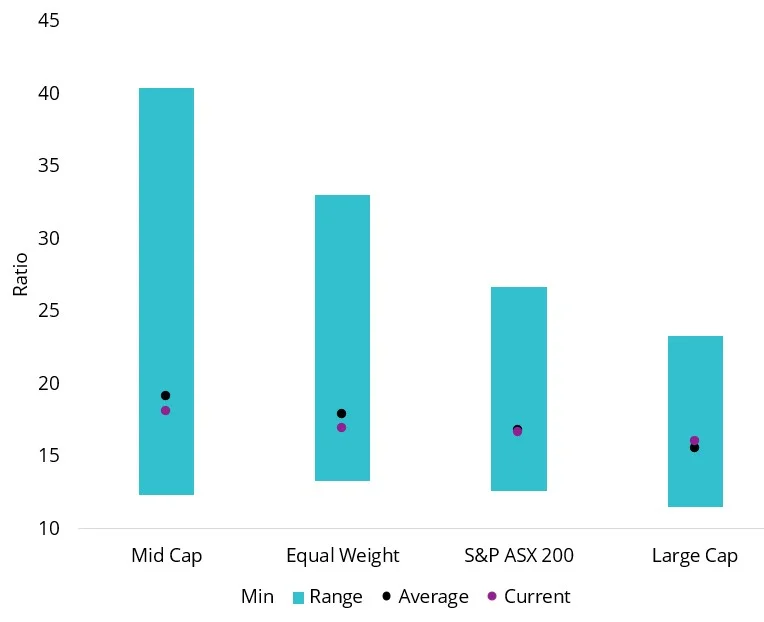
Source: Bloomberg, 1 April 2014 to 29 February 2024 (Forward PE ratio), Large Cap as S&P/ASX 20, Mid Cap as S&P/ASX Mid Cap 50, Small Cap as S&P/ASX Small Ordinaries, Equal Weight as MVIS Australia Equal Weight. The ASX index series is shown for comparison purposes as it is the widely recognised benchmark series used to measure the performance of the Australian equities market. It weights companies by market capitalisation. MVW’s index (MVIS Australia Equal Weight) measures the performance of the largest and most liquid ASX-listed companies, weighted equally at rebalance. MVW’s index has a different amount of companies and different industry allocations than the S&P/ASX indices.
The VanEck Australian Equal Weight ETF (MVW) equally weights the largest and most liquid stocks on the ASX at each rebalance. Because of this, at the last rebalance, no company was more than 1.32%. Compared to many Australian equity portfolios, MVW has less exposure to the mega-caps that dominate the S&P/ASX 200 Index. MVW is underweight mega-cap companies and overweight those large companies outside the mega-caps, i.e. those with price targets revised up, and more earnings per share growth.
Chart 6: Market Cap Weight Differential: MVW vs S&P/ASX 200
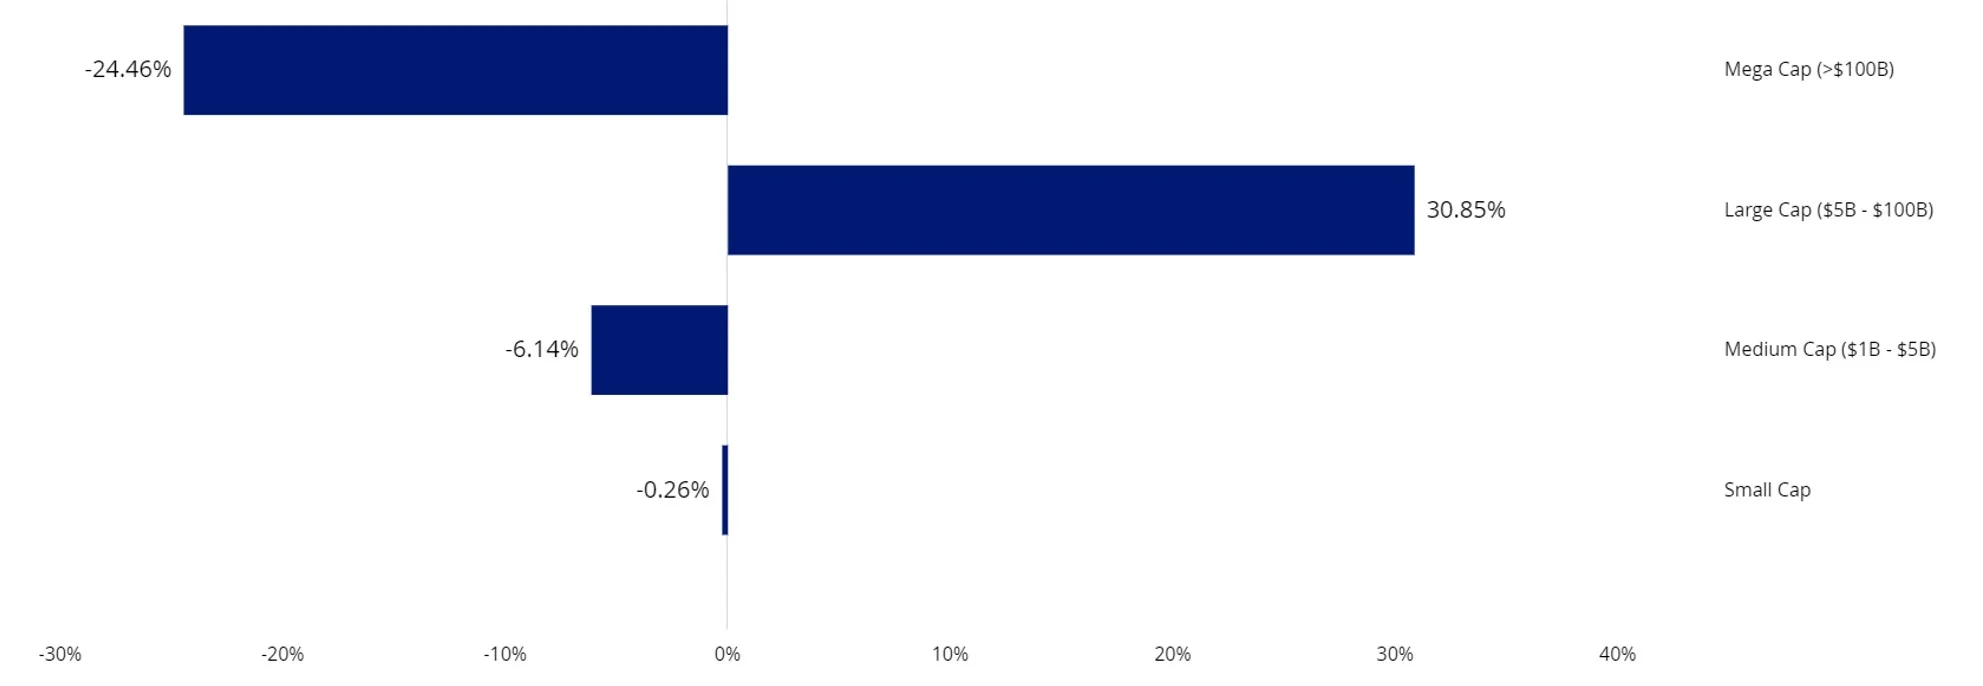
Source: VanEck, FactSet; as at 29 February 2024.
We have written in the past about MVW’s long term performance. In addition to MVW, another way to take advantage of the current market dynamics is our recently launched VanEck Geared Australian Equal Weight Fund (Hedge Fund) (GMVW).
GMVW invests in MVW, one of the best-performing Australian equity funds since it launched almost 10 years ago. While gearing the S&P/ASX 200 for example, amplifies your already significant exposure to BHP and the big ‘4’ banks, GMVW magnifies your exposure to those stocks outside the mega-caps.
Key risks: Gearing means that GMVW borrows money to increase the amount it can invest. While this can result in larger gains in a rising market, it can also magnify losses in a falling market. The greater the level of gearing in GMVW, the greater the potential loss of capital. GMVW is considered to have a higher investment risk than a comparable fund that is ungeared. Investors should actively monitor their investment as frequently as daily to ensure it continues to meet their investment objectives. The key risks are outlined in the PDS.


Published: 26 March 2024
Any views expressed are opinions of the author at the time of writing and is not a recommendation to act.
VanEck Investments Limited (ACN 146 596 116 AFSL 416755) (VanEck) is the issuer and responsible entity of all VanEck exchange traded funds (Funds) trading on the ASX. This is general advice only and does not take into account any person’s financial objectives, situation or needs. The product disclosure statement (PDS) and the target market determination (TMD) for all Funds are available at vaneck.com.au. You should consider whether or not an investment in any Fund is appropriate for you. Investments in a Fund involve risks associated with financial markets. These risks vary depending on a Fund’s investment objective. Refer to the applicable PDS and TMD for more details on risks. Investment returns and capital are not guaranteed.