Why REITS (Real Estate Investment Trusts) and resources should be on your radar
A-REITS and resources should be on your radar.
A-REITS and resources should be on your radar.
Australian Real Estate Investment Trusts (A-REITs)
A-REITs have had a 2022 they would rather forget, underperforming the market by over 18%. But, this year’s worst performer could become next year’s rising star. REITs rough run in 2022 has mainly been driven by a sharp increase in the 10-year bond yield, have more than doubled. However, we believe long dated government bond yields could be close to reaching their peak, and Reserve bank of Australia prioritising growth over inflation could provide tailwinds for REIT performance.
The RBA has started to temper the rate of cash rate increases over the past two months despite Australian inflation reaching a 40 year high in Q3 and expectations it will further increase in Q4 2022. The RBA increased the cash rate in October and November by 25 basis points, below market expectations of 50 basis point hikes on both occasions. This approach indicates that for 2023 the RBA is prioritising economic growth over containing inflation quickly. RBA increased their Australian CPI forecast for 2023 from 2.75% to 4.75% over the past 4 quarters. In contrast, the Fed is resolute on driving down inflation to 2% despite actions increasing the risk of a US recession ‘hard landing’.
The RBA’s focus is positive for potentially oversold A-REITs for three reasons.
Central bank forecasts for inflation and GDP growth in 2023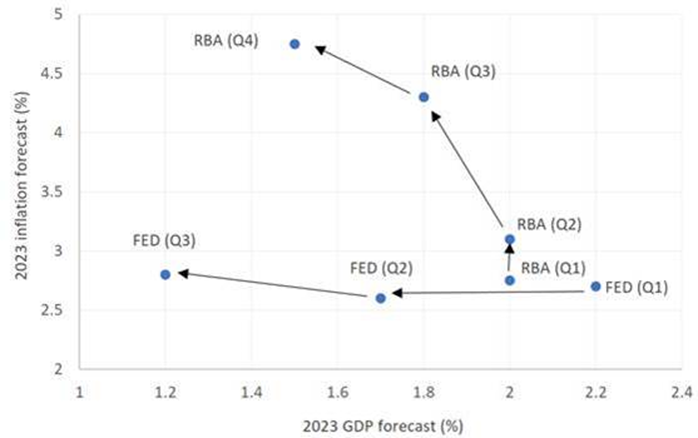
Source: RBA, Federal Reserve
1. REIT income inflation linked
REITs historically outperform during persistent inflation periods. The RBA is forecasting inflation to be above its target in 2023. Commercial leases and contracts in office and logistics typically have inflation linked annual increases in rents written into the contract, providing inflation protection on income. An example was between the end of the dot-com bubble and Global Financial Crisis. During this period, Australian CPI year-on-year was 2.9 per cent on average and Australian 10-year government bond yields steadily increased over this time where Australian REITs as represented by S&P/ASX 200 A-REITs outperformed S&P/ASX 200 by 3.99% between 1 January 2002 and 31 December 2006.
2. Government bond yields moderating
REIT performance is negatively correlated with bond yield movements due to the change in borrowing costs impact on property valuations. The increase in government bond yields year to date due to rapid increases in the expected RBA cash terminal rate has been a major headwind for REIT performance.
A-REITs performance relative to S&PASX 200 versus Australian government 10-year bond yield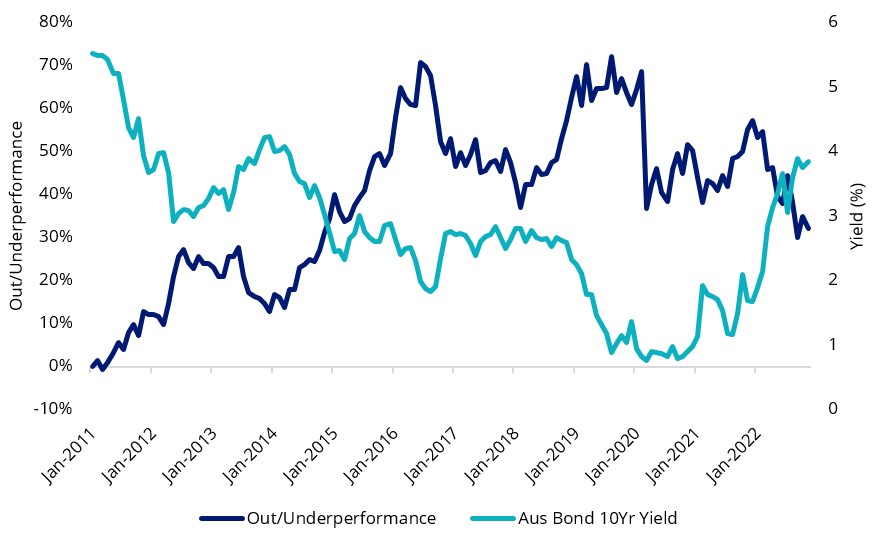
Source: Bloomberg, Out/Underperformance as MVIS Australia A-REIT cumulative performance relative to S&P/ASX 200. Past performance is not indicative of future results.
However, long dated government bond yields could be close to reaching their peak. Broker consensus is Australian Government bond 10-year yield will remain at similar levels over the next two years. Bond markets have priced in expected further RBA cash rate increases and there is a chance the RBA starts cutting the cash rate in late 2023 as the global economy slows, putting downward pressure on government yields. If yields fall, this would be a tailwind for REIT performance.
Australian government 10-year bond yield median broker forecast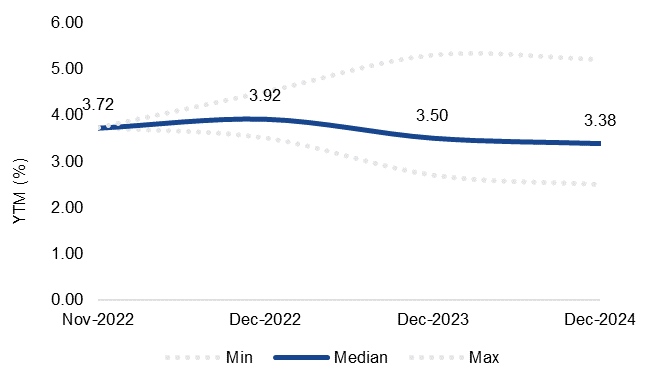
Source: Bloomberg, As at 9 November 2022.
3. Valuations attractive
The asset deflation bear market we have seen year to date has improved the valuation profile of REITs. Price to Adjusted Funds From Operations (AFFO multiple) is at a nine year low and Price to net tangible assets (NTA) at a 15% discount. These measures are market convention for valuing REITs and are preferred to metrics such as price to earnings ratios.
A-REIT AFFO Multiple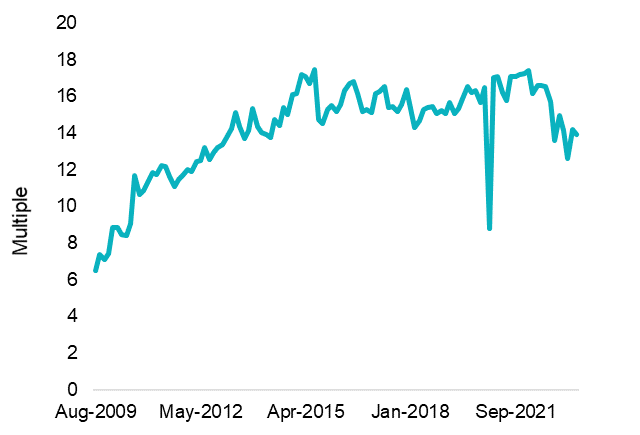
Source: Bloomberg, A-REIT as MVIS Australia A-REIT Index
A-REIT Price to NTA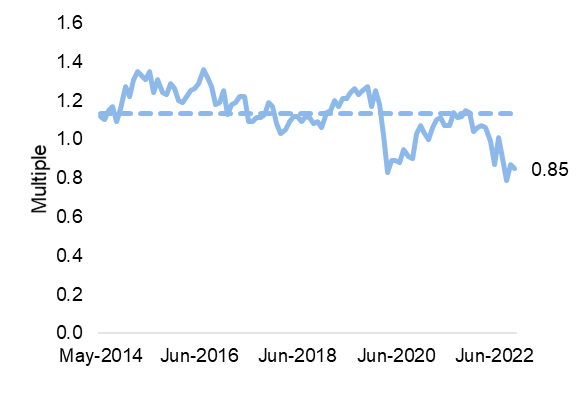
Source: Bloomberg, A-REIT as MVIS Australia A-REIT Index
Australian Resources
During the global financial crisis, China’s demand for Australia’s natural resources was the savior in helping the country avoid a technical recession defined as two consecutive quarters of negative gross domestic product (GDP) growth. Governments such as China often turn to infrastructure spending as a fiscal measure to expand economic growth in an economic downturn. This could be repeated.
China’s COVID zero policy has weighed negatively on growth and consumption. There will come a point in near future where the country shifts its stance and completely opens to the rest of the world. Markets in the region are etching for this good news with Hong Kong (Hang Seng) and China onshore (CSI 300) benchmarks jumping more than 3 percent in a single day in recent weeks on mere speculation of a shift in policy.
The potential reopening of a country with 1.4 billion residents offers investment opportunities, particularly within Australian sectors that have high revenue exposure to China.
Chinese President Xi Jinping has cited infrastructure spending as the government’s main lever to rescue economic growth. The Australian resources sector could once again be a major beneficiary of this investment, as it was during the Global Financial Crisis (GFC).
At the end of 2009, China’s year on year infrastructure investment sky rocketed to 54 per cent, from 10 per the previous year. The spending, helped resurrect economic growth during the lows of the GFC. As a result, Australian commodity export prices soared, and mining as a percentage contribution of Australian GDP jumped, boosting Australian resource companies.
China Infrastructure Investment YoY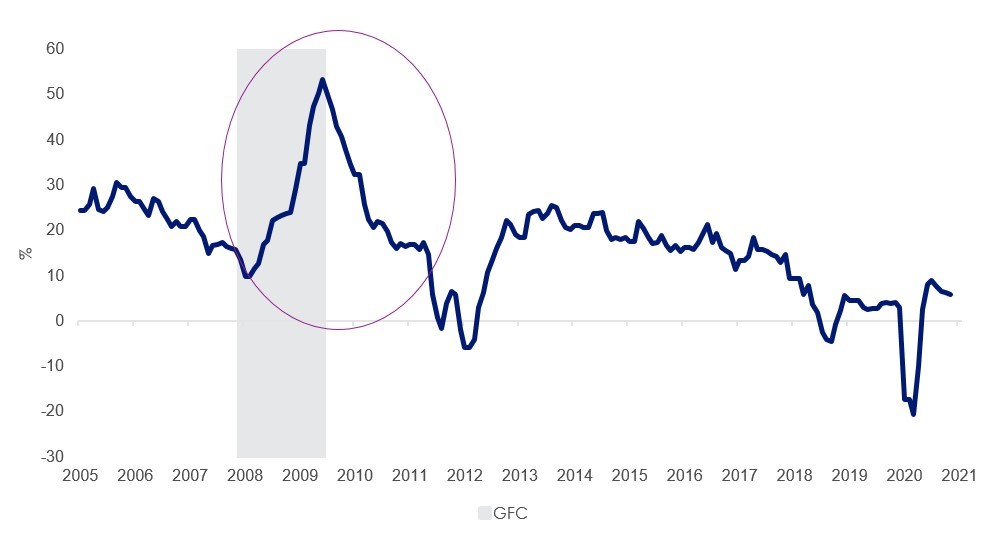
Source: Bloomberg, 31 October 2022
RBA Commodity Export Price Index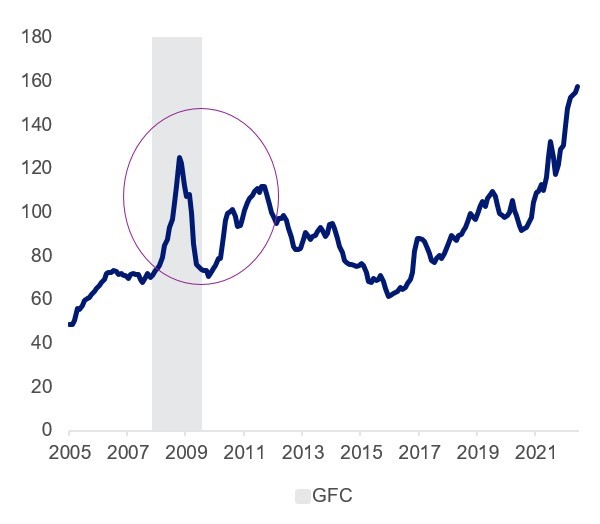
Source: Bloomberg, 31 October 2022
Mining as a share of Australian GDP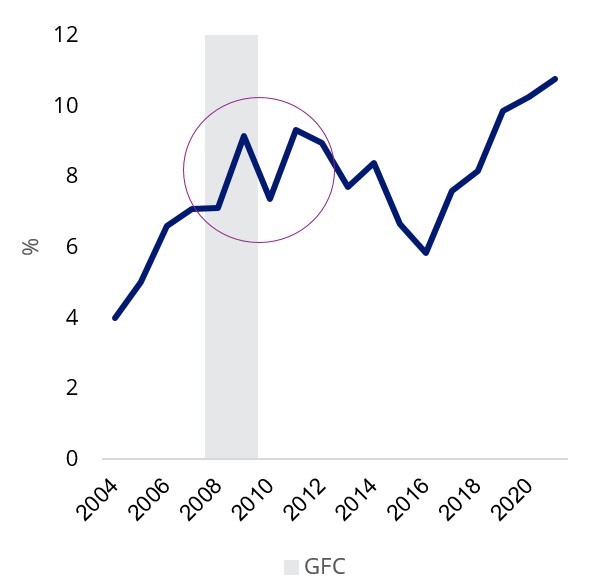
Source: ABS, as at 31 October 2022
Despite geopolitical tensions, and Chinese sanctions on some major Australian exports, China remains reliant on Australian mining resources. 19 per cent of Australian mining revenue is attributed to China, based on the constituent weighting of MVIS Australia Resources Index.
Australia resources revenue attributed to China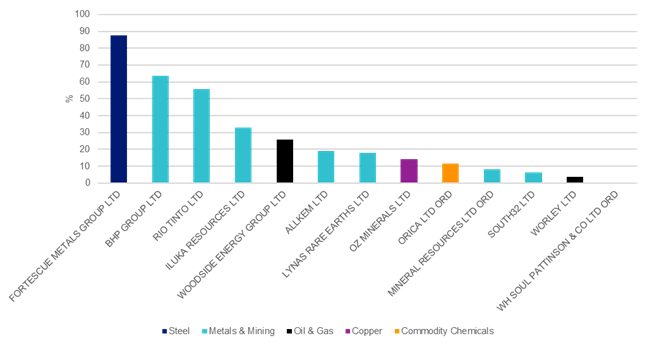
Source: Factset, As at 30 June 2022.
The recent downturn in global markets and economic weakness in China has improved the valuation profile of Australian resources. Price to 12-month forward cash flow is at a historic low and Iron ore prices have dropped to 2018 levels.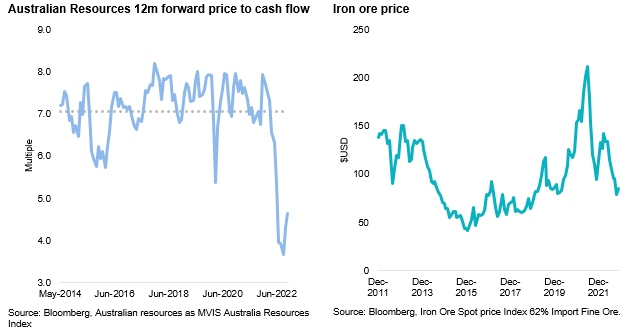
Access to Australian Property
VanEck Australian Property ETF (ASX: MVA) tracks the MVIS Australia A-REIT index which caps stock weighting at 8 percent. This improves stock diversification and results in underweight industrials exposure relative to the S&P/ASX 200 A-REIT Index.
Access to Australian Resources
VanEck Australian Resources (ASX ticker: MVR) tracks MVIS Australia Resources Index offering investors broad exposure to the Australian resources sector. The ETF provides overweight exposure to oil, gold, coal, copper and aluminium relative to S&P/ASX 200 Resources index.
GICs sub industry breakdown: MVR versus S&P/ASX 200 Resources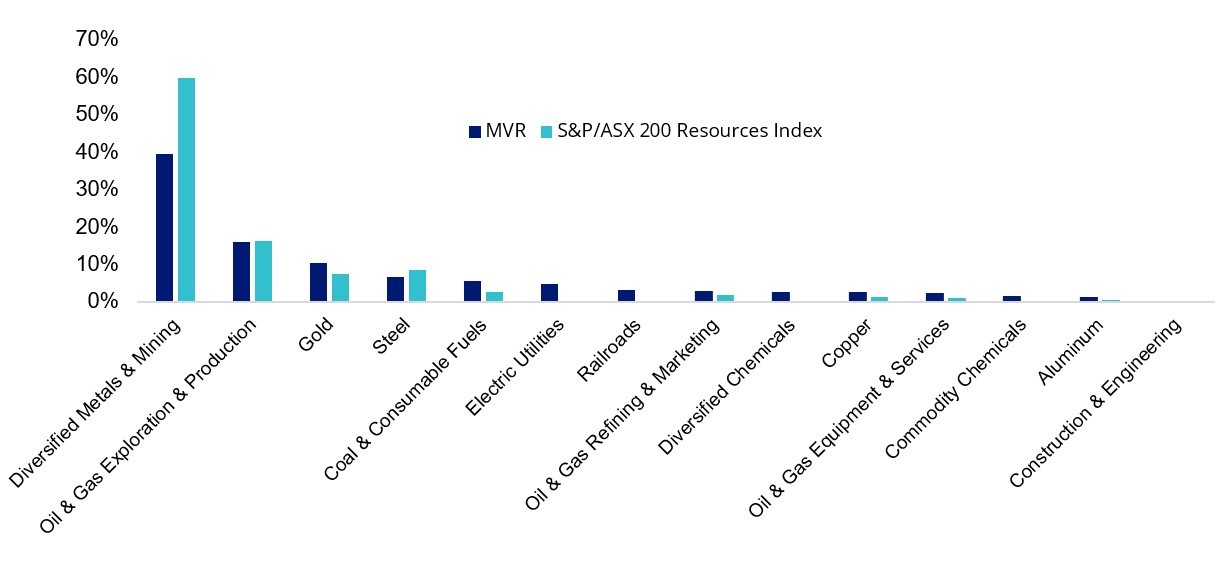
Source: FactSet; as at 30 June 2022
Key Risks
An investment in MVA or MVR carries risks associated with: financial markets generally, individual company management, industry sectors, stock and sector concentration, fund operations and tracking an index. See the relevant PDS for details.


Published: 22 November 2022