Emerging markets are drumming to a different beat
A weakening US dollar and strengthening commodity prices have fuelled the biggest rally in emerging markets since 2010.
It could be the start of an emerging market summer, but it certainly pays to be selective.
Emerging markets are drumming to a different beat to developed markets, with many having tamed inflation already. Hungary’s central bank is already easing, and China is predicted to start easing soon, as are Brazil (this week), the Czech Republic, Poland and Malaysia. Falling rates are good for equities in those countries and this is being reflected in share market prices. Emerging market equities, as represented by the MSCI Emerging Markets Index, have outperformed many developed markets, including our own, so far this year. However not all companies in emerging markets are desirable from an investment perspective and timing factors and cycles in emerging markets is near impossible.
Is summer is coming for emerging markets?
After a fifteen-year winter, in 2023 emerging markets have been taking off. As the US dollar weakens, emerging market’s overall have tamed inflation while its middle-class flourishes and investors consider China’s growth/reopening plans.
The last time emerging markets experienced a sustained bull run was during the early 2000s, during the commodity super-cycle, of which Australia was a beneficiary, so local investors did not need to consider diversifying into emerging markets to benefit from that macroenvironment. This time however the macroeconomic outlook between Australia and emerging markets differs, and as one of the reasons to invest internationally is to diversify your exposure to different economic cycles, now could be the time to consider emerging markets.
As an example of the differences, Brazil started cutting rates last week, long overdue – the real policy rate there is nearing 10%. In China, “dovish” (supportive) statements by the government and the central banks in the past few weeks regarding problematic areas such as housing and private companies have paved the way for a “Politburo rally”.
China’s policy easing is in contrast with more tightening expected in developed markets.
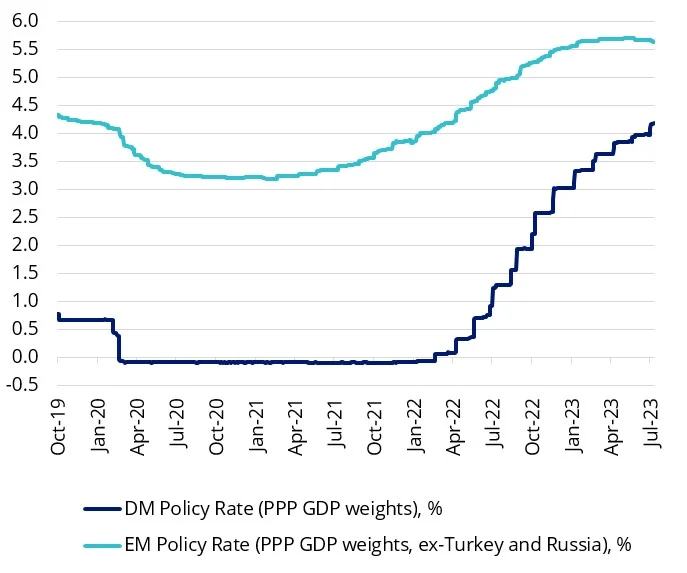
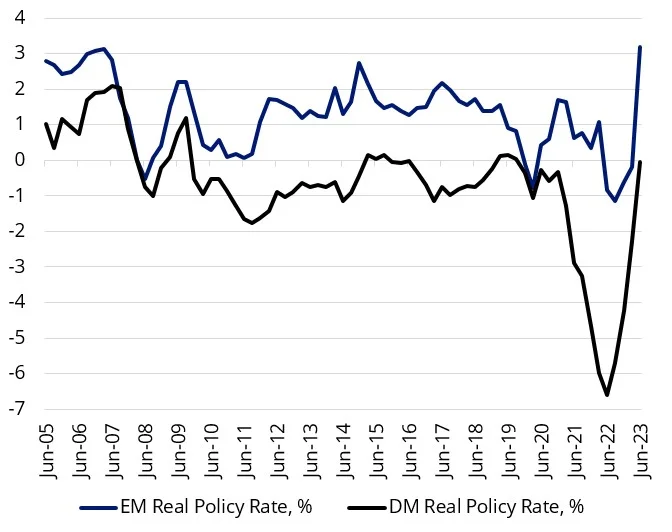
The current global tightening cycle is unusual because it was led by emerging markets, which started hiking much earlier and larger than the RBA and the Fed to address rising inflation pressures. As a result, real policy rates (rates minus inflation) in emerging markets are much higher than those in developed markets. As some emerging central banks are loosening or preparing to loosen, benefiting companies in those jurisdictions, it is likely that rate rises will continue in many developed markets while inflation remains elevated and real rates remain below zero.
|
Chart 1: Policy rates in major emerging markets and developed markets (%) |
Chart 2: Ex post real policy rates in emerging markets and developed markets (%) |
 |
 |
|
Source: VanEck Research; Bloomberg LP. Data as of 31 July 2023. |
Emerging markets has several other tailwinds that many developed markets may not be able to catch. A weakening US dollar has historically benefited emerging markets. In addition, we would argue that the current geopolitical environment favours emerging markets, as these economies generally export more than they import, and they also benefit from high commodity prices and energy re-orientation. China’s reopening benefited its close neighbours such as Indonesia, Malaysia and Thailand. Thailand, for example, benefits from Chinese tourism (3% of GDP) and exports to China (24% of GDP).
During the post-GFC winter, emerging market equities had many false starts, but this most recent rally could be the start of an emerging markets summer.
But it pays to be selective.
Being selective in emerging markets
Emerging markets are known to be inefficient, so ripe for active managers to add value. In addition to being expensive, returns among active managers vary significantly from year to year because it is almost impossible for them to time factors in emerging markets. There is another approach.
EMKT tracks the MSCI Emerging Markets Multi-Factor Select Index (EMKT Index) which includes companies on the basis of four factors: Value, Momentum, Low Size and Quality. The four factors combined have demonstrated strong performance relative to the MSCI Emerging Markets Index.
Table 1: Performance as at 31 July 2023
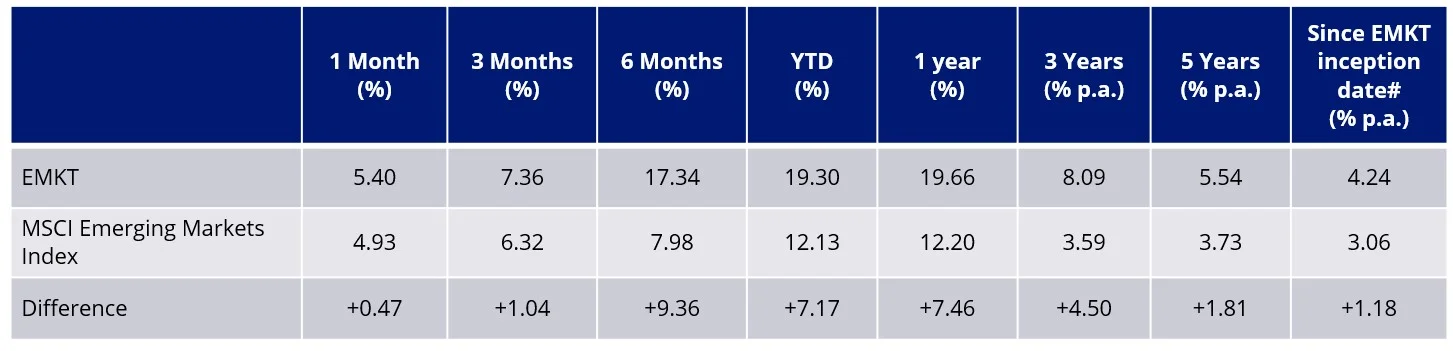
Source: VanEck, Morningstar Direct. #EMKT inception date is 10 April 2018 and a copy of the factsheet is here.
Performance is calculated net of management fees, calculated daily but do not include brokerage costs or buy/sell spreads of investing in EMKT. Past performance is not a reliable indicator of future performance. The MSCI Emerging Markets Index (“MSCI EMI”) is shown for comparison purposes as it is the widely recognised benchmark used to measure the performance of emerging markets large- and mid-cap companies, weighted by market capitalisation. EMKT’s index measures the performance of emerging markets companies selected on the basis of their exposure to value, momentum, low size and quality factors, while maintaining a total risk profile similar to that of the MSCI EMI, at rebalance. EMKT’s index has fewer companies and different country and industry allocations than MSCI EMI. Click here for more details
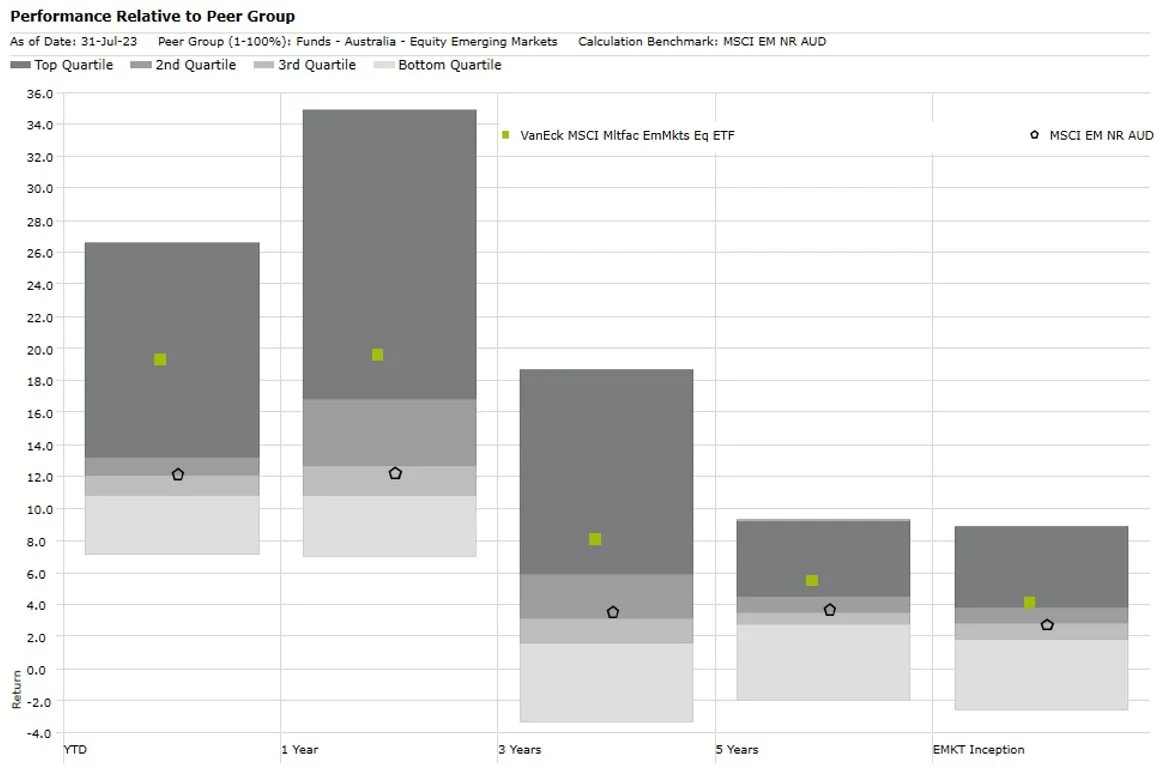
EMKT’s performance, to the end of last month, puts it in the top quartile of active peers over one, three and five years.
Top quartile performance for lower management fees
The impressive performance above has been achieved for a management fee of just 0.69% p.a., just one basis point above the market beta EM equivalent. EMKT is one of the lowest-cost funds in its peer group.
As you can see below, EMKT's low management fee stands out among those managers that can boast outperformance over the past five years to the end of July 2023. You can see most actively managed funds charge much higher fees, generally between 1% and 1.5% p.a. What this means is that active managers must outperform EMKT by at least the difference between their total fees (including performance fees) and EMKT’s lower management fees to just break even with EMKT every year. With performance between active managers varying year-to-year, there is little wonder many advisers are allocating to EMKT to take advantage of the inefficiencies that exist within emerging markets and using their fee budget elsewhere.
Chart 3 – Emerging markets equity: Five- year performance (p.a.) versus management fees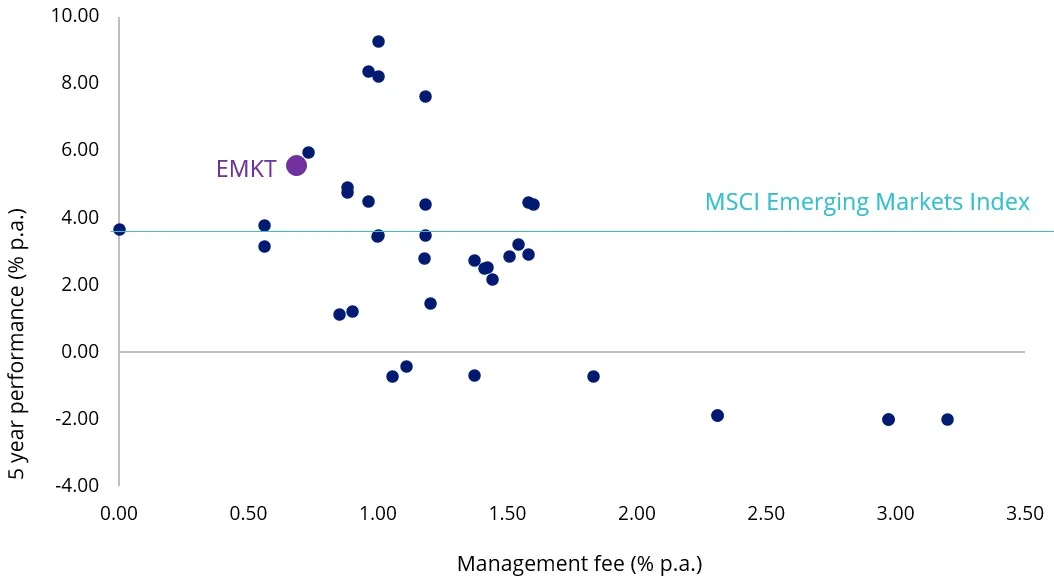
Source: Morningstar, to 31 July 2023. Past performance is not a reliable indicator of future performance. Results are calculated to the last business day of the month and assume immediate reinvestment of distributions. Results are net of management fees and other costs incurred in the fund, but before brokerage fees and bid/ask spreads. Returns for periods longer than one year are annualised. Peer group Equity Region Emerging Markets funds invest in companies listed in emerging markets from around the globe. Emerging market securities typically account for at least 75% of the portfolio. Management costs are Indirect Cost Ratio (ICR) in Morningstar Direct.
Key risks:
All investments carry risk. An investment in EMKT carries risks associated with ASX trading time differences, emerging markets, financial markets generally, individual company management, industry sectors, foreign currency, country or sector concentration, political, regulatory and tax risks, fund operations, liquidity and tracking an index. See the PDS for details.

Published: 14 August 2023
VanEck Investments Limited (ACN 146 596 116 AFSL 416755) (VanEck) is the issuer and responsible entity of all VanEck exchange traded funds (Funds) listed on the ASX. This is general advice only and does not take into account any person’s financial objectives, situation or needs. The product disclosure statement (PDS) and the target market determination (TMD) for all Funds are available at vaneck.com.au. You should consider whether or not any Fund is appropriate for you. Investments in a Fund involve risks associated with financial markets. These risks vary depending on a Fund’s investment objective. Refer to the applicable PDS and TMD for more details on risks. Investment returns and capital are not guaranteed.
EMKT is indexed to a MSCI index. EMKT is not sponsored, endorsed, or promoted by MSCI, and MSCI bears no liability with respect to EMKT or the MSCI Index. The PDS contains a more detailed description of the limited relationship MSCI has with VanEck and EMKT.