Great rotations: The value factor
In December, the ‘Value trade’ continued to do well as the US Federal Reserve made the environment for the style more conducive by signalling inflation concerns and that it expects to raise rates faster than expected.
In December, the ‘Value trade’ continued to do well as the US Federal Reserve made the environment for the style more conducive by signalling inflation concerns and that it expects to raise rates faster than expected.
Higher rates reduce the value of companies’ future earnings, which weighs more on growth companies with their profit expected in years ahead.
Value stocks are less sensitive to changes to macroeconomic conditions and have a history of emerging as the winning ‘factor’ following a recession.
The return of rising rates
US inflation exceeded five per cent, well above US Federal Reserve’s long-term target of two per cent. Prior to the end of the last quarter, markets and US Federal Reserve had shrugged off this concern, citing that the drivers were ‘transitory’ as opposed to persistent, expecting inflation to “cool off”.
That has changed. Chairman of the US Federal Reserve, Jerome Powell said of ‘transitory’, “I think it's probably a good time to retire that word and try to explain more clearly what we mean,” during a congressional hearing at the start of December, 2021.
The market reacted almost immediately, with rate rises expected as early as this year and inflationary pressures expected to persist.
Chart 1: US Fed fund rate, expectations and wages pressure
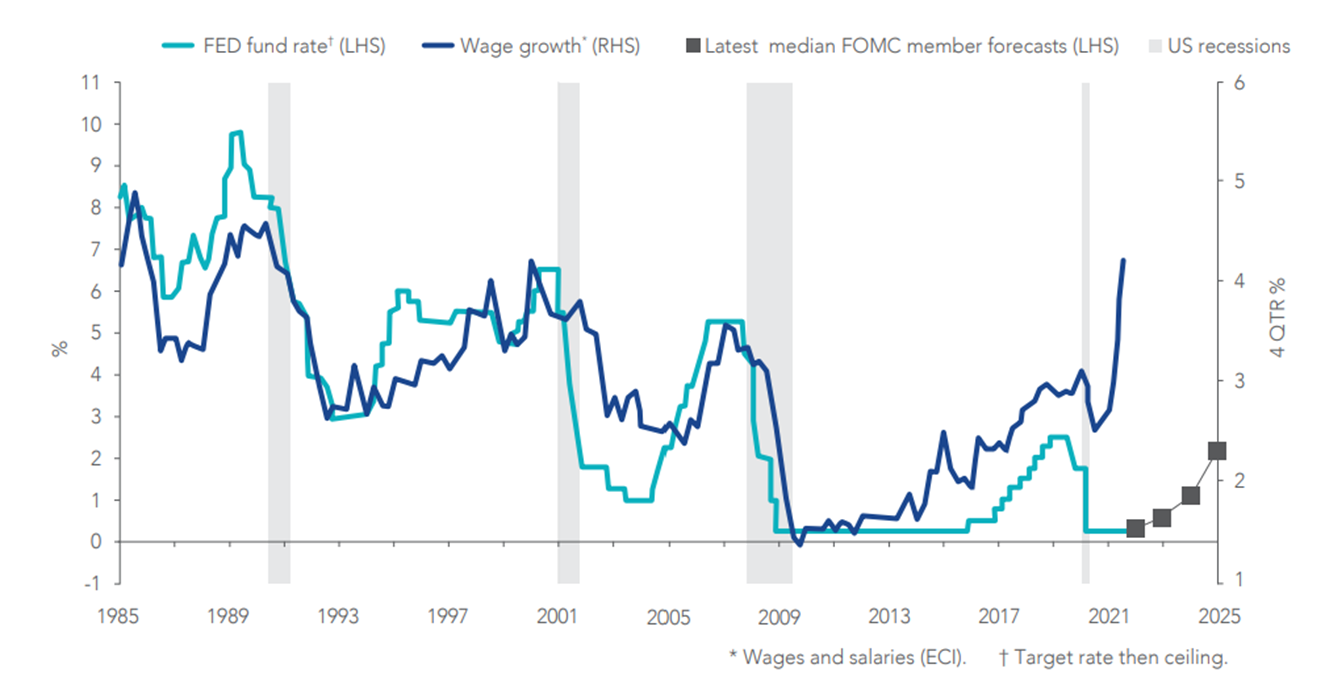
Source: US Bureau of Labor Statistics, Federal Reserve, National Bureau of Economic Research
The impact of rising rates and high inflation on equity markets
Historically, Value companies have outperformed when inflation and interest rates increase, as they are less sensitive to changes in macro-economic conditions. High inflation and rising rates were characteristics of markets in the late 70s and 80s.
Chart 2 - Five year per annum performance comparisons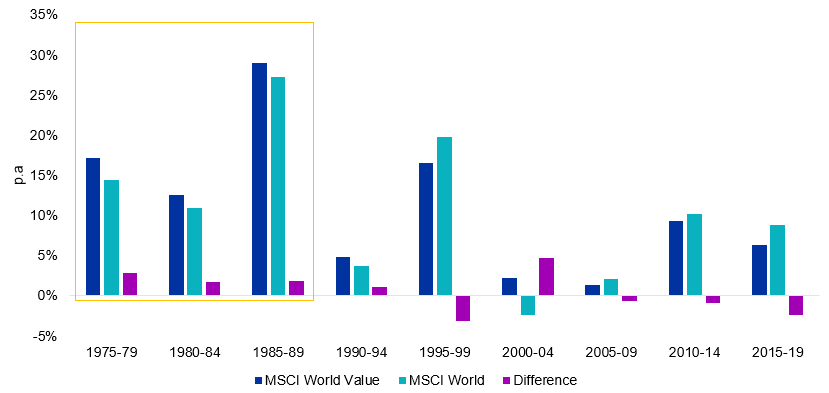
Source: Bloomberg. MSCI, MSCI World Value index inception 31 December 1974. Past performance is not a reliable indicator of future performance.
Given this, investors seeking to tap the current trends may wish to consider the VanEck Vectors MSCI International Value ETF (VLUE). It is worthwhile noting that the December month outperformance is not an historical aberration. Since the turn of the century the value factor has outperformed the MSCI World ex Australia Index, despite its ‘lost decade’ past the GFC.
Based on back testing, the index VLUE tracks (net of VLUE’s 0.40% p.a. management costs) displays strong long-term performance, as highlighted by the chart below.
Chart 3: Modelled cumulative performance: VLUE’s index1after fees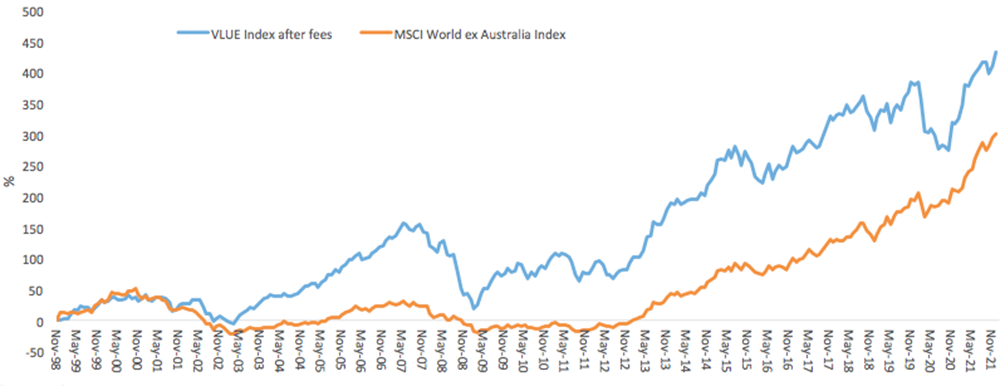
Table 1: Trailing returns
Performance as at 31 December 2021
|
1 Month |
3 Months |
Since VLUE inception date2 |
1 Year |
3 Years |
5 years |
10 years |
20 years |
|
|
VLUE |
4.27 |
3.29 |
14.60 |
|
|
|
|
|
|
VLUE Index (net of management costs)1 |
|
|
|
27.67 |
9.31 |
6.92 |
11.70 |
7.44 |
|
MSCI World ex Australia Index3 |
1.68 |
7.19 |
27.03 |
29.58 |
20.58 |
15.08 |
16.81 |
6.15 |
Chart 3 and Table 1 Source: VanEck, Morningstar, Bloomberg as at 31 December 2021. Past performance is not a reliable indicator of future performance.
1VLUE Index results are net of VLUE’s 0.40% p.a. management costs, calculated daily but do not include brokerage costs or buy/sell spreads of investing in VLUE. You cannot invest in an index. VLUE’s Index base date is calculated at 30 November 1998. VLUE Index performance prior to its launch on 15 February 2021 is simulated.
2VLUE inception date is 8 March 2021 and a copy of the factsheet is here.
3The MSCI World ex Australia Index (“MSCI World ex Aus”) is shown for comparison purposes as it is the widely recognised benchmark used to measure the performance of developed market large- and mid-cap companies, weighted by market capitalisation. VLUE’s index measures the performance of 250 international large- and mid-cap companies selected from the MSCI World ex Australia Index with high value scores relative to their peers at rebalance. Exclusions apply for weapons and tobacco. Consequently VLUE’s index has fewer companies and different country and industry allocations than MSCI World ex Aus. ‘Click here for more details’. ‘Click here for more details’.
Using Value in a portfolio
As evidenced above, the performance of factors can be cyclical. Value has been used by savvy investors to diversify their other exposures, by combining approaches.
Chart 4: Combining VLUE Index and MSCI World ex Australia Quality Index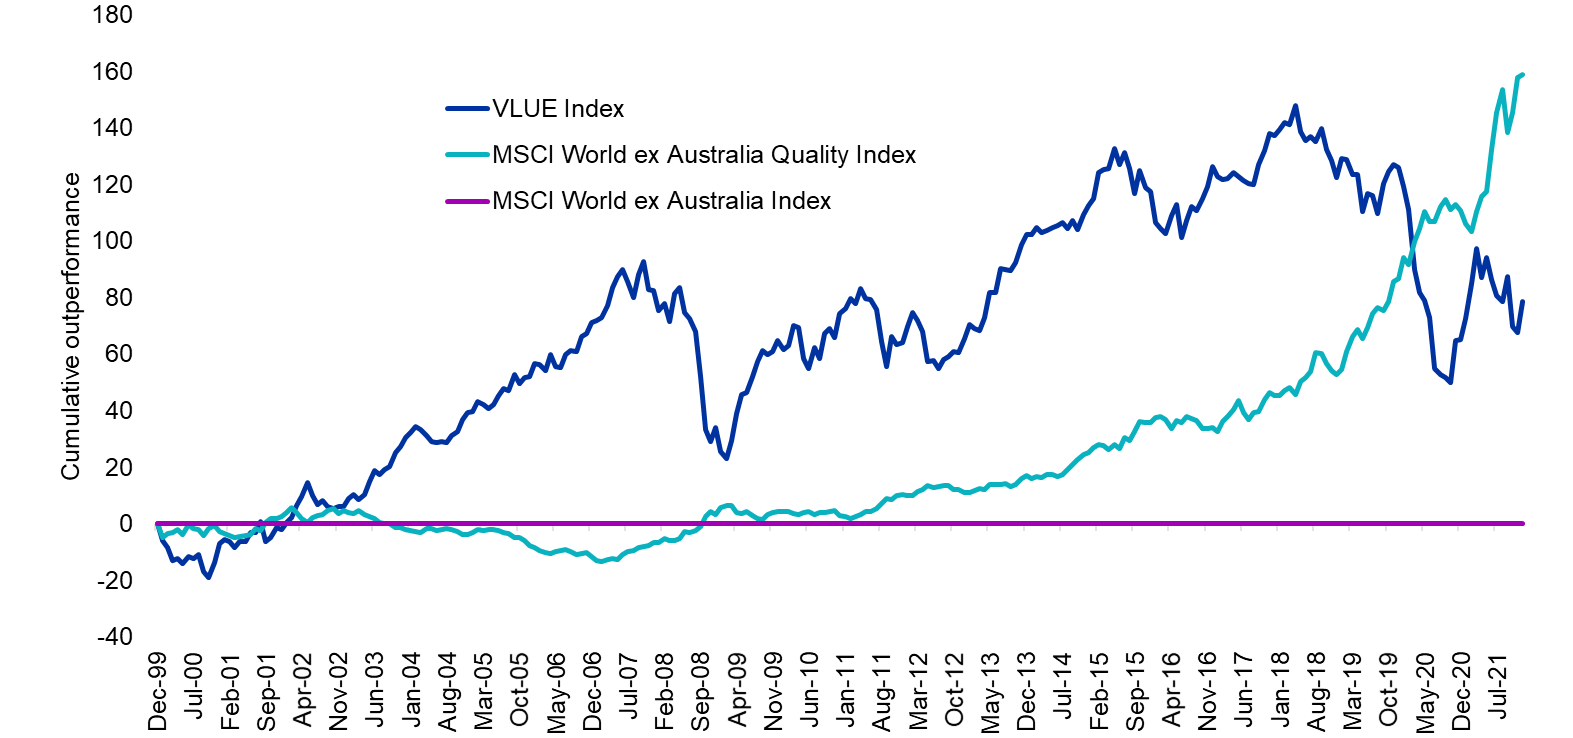
Chart 5: Rolling 12 month correlation: VLUE Index and MSCI World ex Australia Quality Index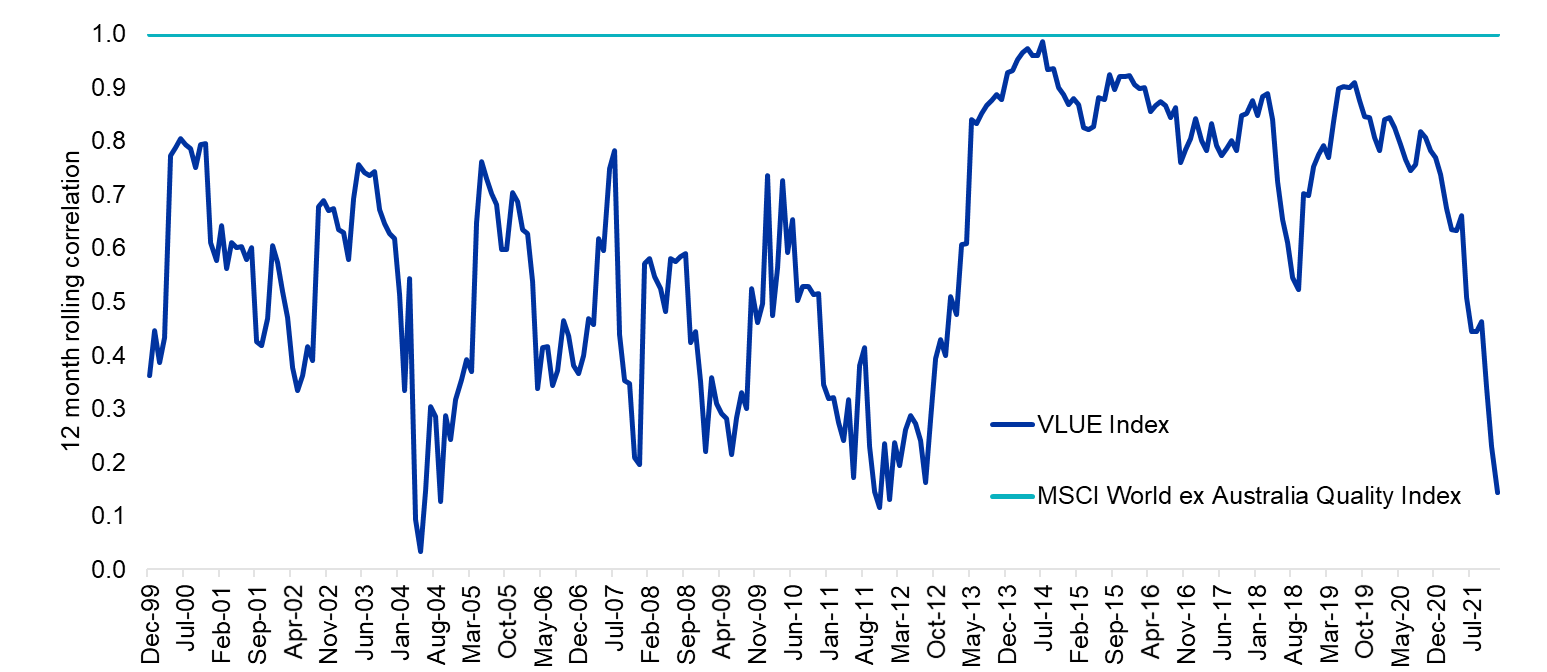
Chart 4 and 5 source: VanEck, Morningstar, Bloomberg as at 31 December 2021. Past performance is not a reliable indicator of future performance.
Why VLUE?
- International companies exhibiting value characteristics
Access a portfolio of international companies that are selected for their high value score relative to sector peers as measured by MSCI based on: (i) price to book value; (ii) price to forward earnings; and (iii) enterprise value to cash flow from operations. - Long term focus, capturing value across the market cycle
The index is designed to capture a high level of exposure to value while minimising unintended and unwanted sector bets - Diversified across countries, sectors and companies
Offering investors a portfolio of 250 companies across a range of geographies, sectors and economies
Learn more about VLUE here.
Related Insights


Published: 11 January 2022
Any views expressed are opinions of the author at the time of writing and is not a recommendation to act.
VanEck Investments Limited (ACN 146 596 116 AFSL 416755) (‘VanEck’) is the issuer and responsible entity of all VanEck exchange trades funds (Funds) listed on the ASX. This is general advice only and does not take into account any person’s financial objectives, situation or needs. The product disclosure statement (PDS) and the target market determination (TMD) for all Funds are available at vaneck.com.au. You should consider whether or not an investment in any Fund is appropriate for you. Investments in a Fund involve risks associated with financial markets. These risks vary depending on a Fund’s investment objective. Refer to the applicable PDS and TMD for more details on risks. Investment returns and capital are not guaranteed.
View Index provider disclaimers. Index providers for VanEck funds do not sponsor, endorse or promote the funds.