Taking a 'quality' approach to investing internationally
Australian investors have been investing offshore for some time and the rise of ETFs has increased the opportunity set and further opened the investment landscape.
Investing internationally makes sense. The size of the ASX is less than 2% of total assets invested on exchanges globally. No investor should be missing out on the 98% of opportunities. Some of these opportunities include companies like Google, Apple, Microsoft and Johnson & Johnson (J&J). These are all household names but for Australian investors looking to access their growth, these investment propositions have not been readily available on the ASX.
In addition to accessing companies not listed on ASX, investing offshore also gives exposures to sectors underrepresented in Australia such as healthcare and technology. But not all companies are desirable from an investment point of view. Importantly when investing offshore there are other risks to consider such as currency, geo-political, economic, market and sector risks.
To date the two most popular approaches to investing in international equities have been:
- via an actively managed fund; or
- via a passive fund tracking the benchmark index.
When actively managed funds were first offered to investors, performance was uncertain and the costs were high. Sometimes the returns were good, but often they were not. Many people found this a poor bargain and moved to lower cost passive funds that tracked traditional indices. In these new funds, returns could be thought of as average - not high, not low, just the market average. When it comes to international investing in a passive fund, the widely used benchmark is the MSCI World ex Australia Index, for ease of reading let’s call it the International Equity Index.
Innovations in index design for passive funds are delivering above market benchmark returns over the long term while retaining low costs. It is this approach VanEck offers in international equities and it is being used by savvy investors as a substitute for both.
The innovative approach
At VanEck we have offered investors opportunities to diversify offshore since 1956. Our approach is synonymous with investing great’s Benjamin Graham and his student Warren Buffett’s investment philosophies. Deeply embedded in Benjamin Graham’s value investing philosophy is the concept of quality. In what is considered one of the world’s best investing almanacs “The Intelligent Investor” Benjamin Graham outlines some of the fundamental measures he looks for in a company. There are seven in total but ones that investors should not ignore include a sufficiently strong financial condition, earnings stability and earnings growth.
Enter Quality for international equity investing. Our international Quality ETF (QUAL) tracks the MSCI World ex Australia Quality Index and it targets international companies with a high return on equity (ROE), low leverage/debt and stable earnings. Those fundamentals Graham suggested investors should not ignore and, we would argue, key components for many active managers’ processes.
So let’s walk through the difference between the MSCI World ex Australian Quality Index (QUAL Index) and the International Equity Index.
The comparison
1. FUNDAMENTALS: QUAL vs International Equity Index
Table 1: Statistics and fundamentals
|
|
QUAL |
MSCI World ex Australia |
||
|
Index strategy |
Smart beta – quality |
Market capitalisation weight |
||
|
Number of countries |
22 |
22 |
||
|
Number of sectors |
11 |
11 |
||
|
Number of holdings |
300 |
1495 |
||
|
12mth trailing Dividend Yield |
1.20% |
1.58% |
||
|
Dividend frequency |
Annually |
- |
||
|
Return on equity (ROE) (%) |
26.9 |
12.2 |
||
|
Financial leverage (debt to equity) (x) |
0.5 |
1.8 |
||
|
Earnings per share (EPS) growth rate (%) |
17.1 |
7.0 |
||
Source: VanEck, MSCI, FactSet, as at 31 July 2021. You cannot invest directly in an index.
As you would expect, QUAL has higher ROE, lower debt to equity and a higher EPS growth rate.
2. PERFORMANCE: QUAL vs International Equity Index
Quality international investing has served Australian investors. Across all periods, QUAL has outperformed the International Equity Index – testament to quality investing’s prowess across the range of economic cycles.
Chart 1: Cumulative performance since QUAL inception date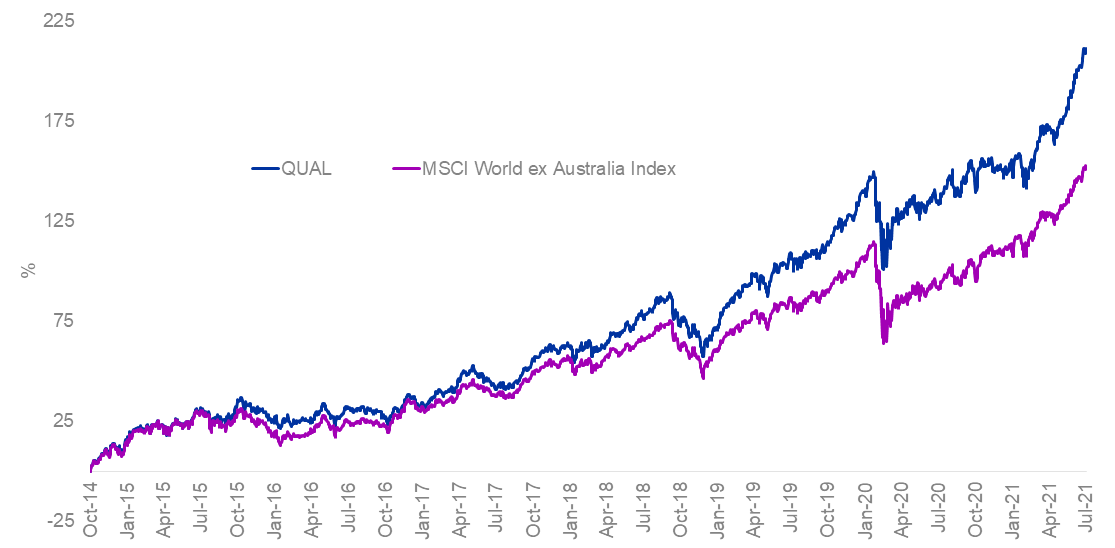
Table 2: Trailing performance
|
1 mth (%) |
3 mths (%) |
6 mths (%) |
1 yr (%) |
2 yrs (% p.a.) |
3 yrs (% p.a.) |
4 yrs (% p.a.) |
5 yrs (% p.a.) |
Since Inception (% p.a.) |
|
|
QUAL |
5.83 |
14.74 |
26.03 |
32.94 |
22.74 |
20.90 |
21.83 |
18.87 |
18.30 |
|
MSCI World ex Australia Index |
4.03 |
10.23 |
21.49 |
31.85 |
16.76 |
15.06 |
16.36 |
15.18 |
14.67 |
|
Outperformance |
+1.80 |
+4.51 |
+4.54 |
+1.09 |
+5.98 |
+5.84 |
+5.47 |
+3.69 |
+3.63 |
*Inception date is 29 October 2014
Chart 1 and Table 2 source: Morningstar Direct, VanEck as at 31 July 2021. The chart and table above show past performance of QUAL and of the MSCI World ex Australia Index. You cannot invest directly in an index. Results are calculated to the last business day of the month and assume immediate reinvestment of distributions. QUAL results are net of management fees and other costs incurred in the fund, but before brokerage fees and bid/ask spreads incurred when investors buy/sell on the ASX. Returns for periods longer than one year are annualised. Past performance is not a reliable indicator of future performance. The MSCI World ex Australia Index (“MSCI World ex Aus”) is shown for comparison purposes, as it is the widely recognised benchmark used to measure the performance of developed market large- and mid-cap companies, weighted by market capitalisation. QUAL’s index measures the performance of 300 companies selected from MSCI World ex Aus based on MSCI quality scores, weighted by market cap x quality score at rebalance. Consequently, QUAL’s index has fewer companies and different country and industry allocations than MSCI World ex Aus. Click here for more details.
3. FLIGHT TO QUALITY: QUAL vs International Equity Index
In investing circles there is a widely used saying ‘flight to quality’. What this means is that when risks are pronounced in markets investors choose quality versus non-quality assets to ride the storm. Historically quality companies have lost less and recovered faster in risky periods associated with market falls. In the table below we have highlighted key systemic crises: the dot-com bubble, GFC, European Sovereign debt crisis and the COVID-19 market meltdown. In all these episodes, Quality International Investors lost less and recovered faster
Table 3: Significant drawdowns, 2000 to 2021
|
|
Quality Index (Maximum Drawdown) |
Benchmark (Maximum Drawdown) |
Relative recovery rate of Quality Index |
|
March 2000 |
-45.02% |
-48.74% |
10 months faster |
|
October 2007 |
-21.95% |
-34.93% |
9 months faster |
|
August 2008 - Lehman Brothers file for bankruptcy |
-14.76% |
-24.73% |
16 months faster |
|
April 2010 - European sovereign debt crisis |
-6.48% |
-13.83% |
11 months faster |
|
February 2020 |
-19.62% |
-23.71% |
8 months faster |
Source: MSCI, VanEck, Morningstar Direct. Comparison of drawdown between the MSCI World ex Australia Quality Index (‘Quality Index’) versus the MSCI World ex Australia Index (‘Benchmark’). Maximum drawdown is the peak to trough decline from the start of the month specified to the recovery date, expressed as a percentage. The rate of recovery is the number of periods taken to recover from the trough to peak incline. The calculations for the above include the reinvestment of all dividends but do not include fees and other costs associated with an investment in QUAL. You cannot invest in an index. Past performance is not a reliable indicator of future performance of the index or QUAL.
4. TOP 10 HOLDINGS: QUAL vs International Equity Index
Below you can see the top 10 companies. The top 10 holdings are companies that investors can relate to in their day-to-day lives – to see all the holdings in QUAL and their weightings click here.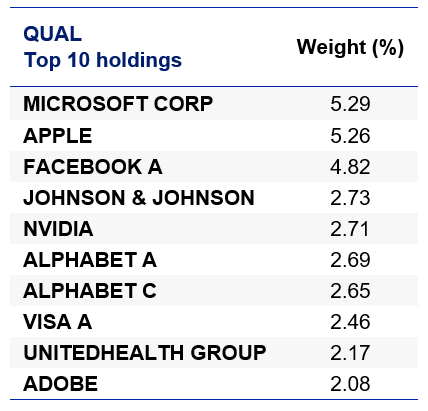
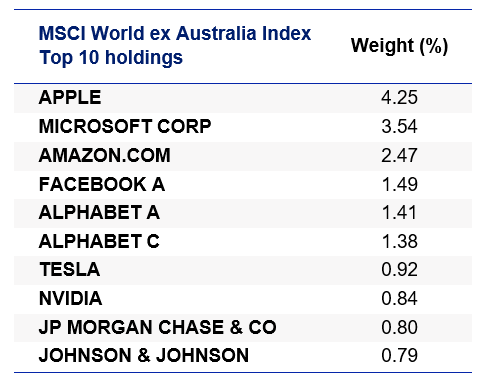
Source: Factset, VanEck, MSCI, as at 31stJuly 2021
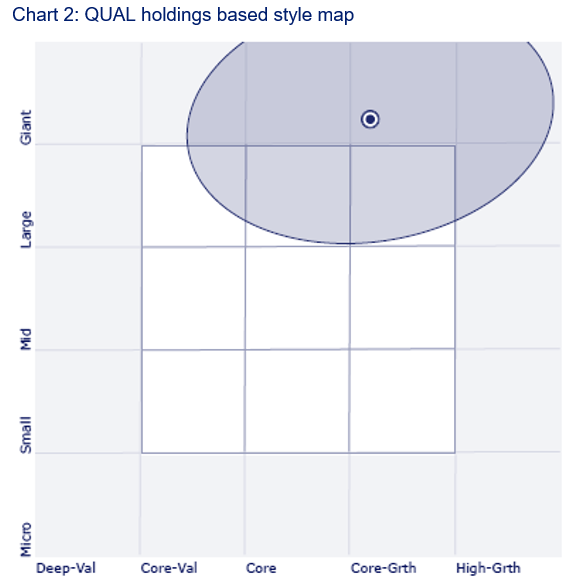
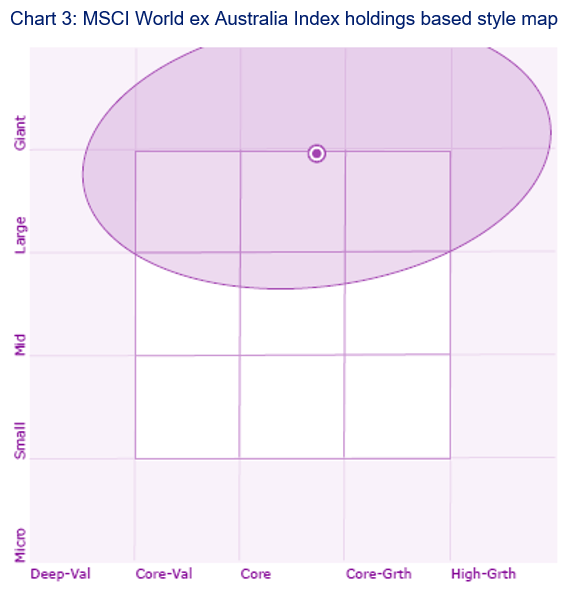
5. STYLE: QUAL vs International Equity Index
When looking at portfolios it is important to determine what style eg value or growth and what size bias a portfolio holds eg giant, large, mid or small. Below we can see QUAL’s. Importantly QUAL holds Giant companies with a core-growth orientation relative to the International Equity Index.
While each International Equity ETF has its merit for portfolio inclusion, you should assess all the risks and consider your investment objectives.
Hedged versions of both of the exposures noted exist too.
Past performance is no guarantee of future performance. The above is not a recommendation. Please speak to your financial adviser or stock broker.
Visit our QUAL product page for further information or you can contact us at +61 2 8038 3300.
Key risks
An investment QUAL carries risks associated with: ASX trading time differences, financial markets generally, individual company management, industry sectors, foreign currency, country or sector concentration, political, regulatory and tax risks, fund operations and tracking an index. See the PDS for details.


Published: 19 August 2021
VanEck Investments Limited ACN 146 596 116 AFSL 416755 (‘VanEck’) is the responsible entity and issuer of units in the VanEck MSCI International Quality ETF. This is general advice only, not personal financial advice. It does not take into account any person’s individual objectives, financial situation or needs. Read the PDS and speak with a financial adviser to determine if the fund is appropriate for your circumstances. The PDS is available here. An investment in QUAL carries risks associated with: financial markets generally, individual company management, industry sectors, ASX trading time differences, foreign currency, country or sector concentration, political, regulatory and tax risks, fund operations and tracking an index. See the PDS for details. No member of the VanEck group of companies guarantees the repayment of capital, the payment of income, performance, or any particular rate of return from any fund.
QUAL is indexed to a MSCI index. QUAL is not sponsored, endorsed or promoted by MSCI, and MSCI bears no liability with respect to QUAL or the MSCI Index. The PDS contains a more detailed description of the limited relationship MSCI has with VanEck and QUAL