REIT rent relief
REITs have been among the worst hit sectors during the COVID-19 market falls as investors feared for rental returns. While there is no question REITs will cut dividends, the price falls of most REITs means that their yields are still relatively attractive.

REITs have been among the worst hit sectors during the COVID-19 market falls as investors feared for rental returns. While there is no question REITs will cut dividends, the price falls of most REITs means that their yields are still relatively attractive.
- Landlords in retail properties are likely to receive less rent because their tenant’s sales have been hit and online sales continue to increase;
- Rent relief available for small and medium sized enterprise tenants will be more adverse to REITs with those tenants compared to others. For example, office landlord Dexus, which has high quality assets in city locations, estimates that only 8% of their tenants will qualify for relief.
It’s important to remember too that there are existing arrangements in place which could have a positive impact on rental earnings. While there is no question that REITs are facing tricky times, they come into these in much better position than they were leading into the GFC.
COVID-19
Australian REITs have been one of the worst hit sectors following the COVID-19 outbreak.
Figure 1. S&P/ASX 200 sector index returns
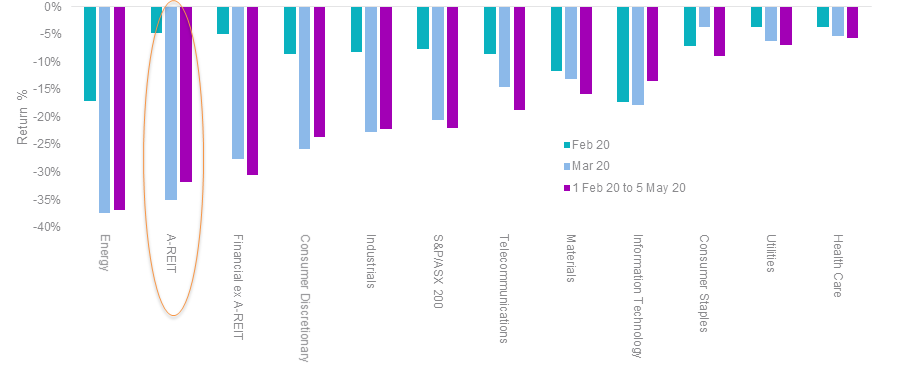
Source: Bloomberg
Impact on yields
In the past, Australian investors have been attracted to A-REITs for the steady income they pay which is linked to rental income. This contrasts to company dividends which can be volatile and, as we’ve seen since the crisis started, stopped or deferred at any time. While there is no doubt that rental income will be impacted by the COVID-19 crisis, the reality is most large employers have continued to pay their rents and maintain premises despite working from home arrangements. This is especially true of office and industrial buildings.
In the years leading up to the pandemic retail A-REITs were providing the best yields, however that sector faces the biggest headwinds with rental income often linked to their tenant’s turnover.
Figure 2: Yields by A-REIT subsector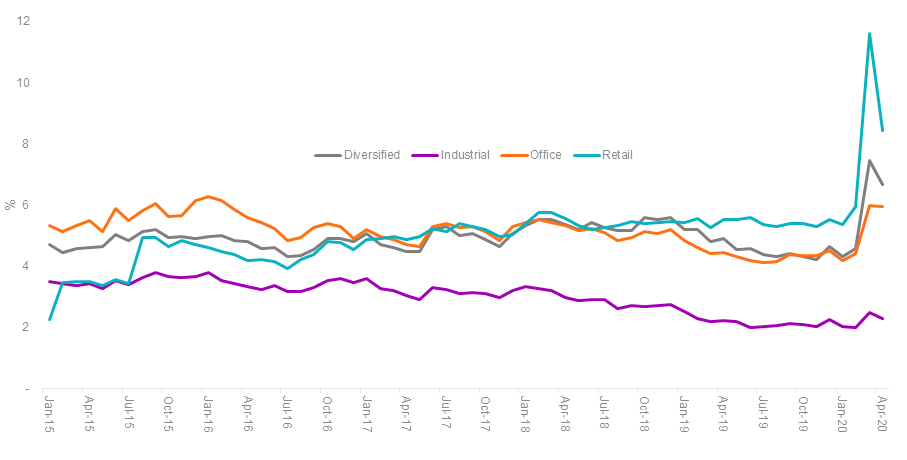
Source: Factset. Subsectors of S&P/ASX 200 A-REIT index
Potential upside surprises in reported earnings
The drawdown in A-REITs since March has also been attributed to the government mandated changes to the tenancy code of conduct. The code applies to commercial tenancies (including retail, office and industrial) for small and medium enterprise tenants (SMEs) with turnover of less than $50 million experiencing financial stress or hardship as a result of the COVID-19 pandemic. This will impact different REITs differently, but those with large tenants will be less impacted. For example, in a conference last week office REIT, Dexus, estimated SMEs (office, retailers and industrial with turnover of less than $50 million) to comprise approximately 8% of total property portfolio income, and is working through if they qualify for relief.
The guidelines also allow for a mixture of rent abatement (at least 50%) and rent deferral, plus both federal and state governments have announced additional tax breaks for business. How REITs negotiate new rental terms could actually have a positive impact on reported earnings. For example under a rent referral arrangement, deferred rent is still considered rental income in 2020 resulting in no impact on reported net operating income (NOI) and funds from operations (FFO). Rent abatement would directly affect NOI. In other words, how rent is treated between the two methods will only partially impact reported earnings, as opposed to the full amount anticipated by investors. This provides a potential opportunity to capitalise on undervalued stocks. Below is the average price to adjusted funds from operations (AFFO) multiple for the index MVA tracks, the MVIS Australian A-REIT Index (MVA Index) index including 20% and 40% assumption reductions in AFFO as at 30 April 2020.
Figure 3. MVA index average adjusted funds from operations (AFFO) multiple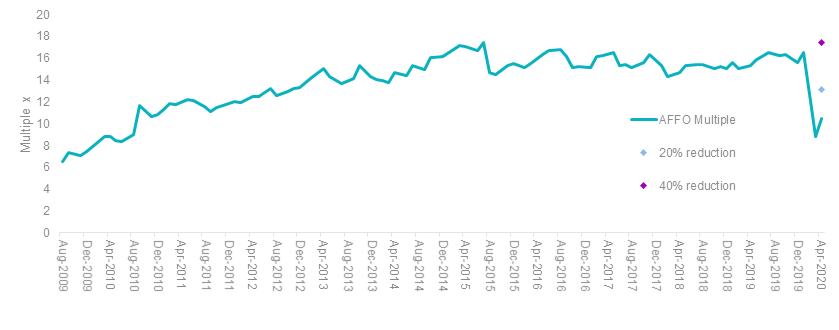
Source: Bloomberg. Hypothetical 20% and 40% are assumptions only. For illustrative purposes only.
This is not 2008
The last crisis to significantly impact A-REITs was the 2008 crisis which was triggered by a credit crisis and those companies with high levels of debt were hit hardest. As a result, then heavily levered, A-REITs were punished by investors.
In the wake of that experience, most A-REITs have been cautious with their balance sheets. Compared to the GFC, they now have lower gearing levels, more diversified debt sources, longer debt tenure and higher interest coverage levels.
In the post 08 recovery, A-REITs were among ASX’s shining stars, outperforming in seven of 12 years including significant outperformance in 2011, 2012, 2014, 2015 and in 2018.
Table 1 Calendar year performance GFC to 2019
|
2008 |
2009 |
2010 |
2011 |
2012 |
2013 |
2014 |
2015 |
2016 |
2017 |
2018 |
2019 |
|
|
S&P/ASX 200 |
-53.99 |
7.92 |
-0.41 |
-1.48 |
32.99 |
7.11 |
27.04 |
14.32 |
13.16 |
5.72 |
2.91 |
19.36 |
|
S&P/ASX 200 |
-38.44 |
37.03 |
1.57 |
-10.54 |
20.26 |
20.20 |
5.61 |
2.56 |
11.80 |
11.80 |
-2.84 |
23.40 |
|
Difference |
-15.55 |
-29.11 |
-1.98 |
+9.06 |
+12.73 |
-13.09 |
+21.43 |
+11.76 |
+1.36 |
-6.08 |
+5.75 |
-4.04 |
Source: Morningstar Direct. Past performance is not a reliable indicator of future performance. Results are calculated to the last business day of the month and assume immediate reinvestment of all dividends and exclude costs associated with investing in an ETF. You cannot invest directly in an index
What the table above highlights too, is the difficulty of timing the market.
Achieving a diversified listed property exposure
Exchange traded funds (ETFs) can provide instant diversity within/across an asset class with one trade on ASX. As an example, VanEck Vectors Australian Property ETF (ASX: MVA) tracks the MVIS Australian A-REIT Index which is a smart beta index. It includes only the largest and most liquid ASX-listed REITs and has no foreign listings or associated withholding tax deducted from dividends and a maximum individual holding of 10%. In contrast, the largest constituent of the S&P/ASX 200 A-REIT Index accounted for 24.54% alone as at 30 April 2020 and that index also includes a foreign listing. As a result of the capping, MVA reduces stock and sub-sector concentration that exists in the S&P/ASX 200 A-REIT Index. Below is a table of all the holdings in MVA and their fundamentals.
Table 2 Holdings and fundamentals of MVA
|
Name |
Sub-sector |
Weight in MVA (%) |
Weight in S&P/ASX 200 |
Dividend Yield |
P/E |
P/BV |
P/CF |
Payout Ratio |
A/E |
|
Goodman Group |
Industrial |
12.04 |
24.54 |
2.20 |
16.73 |
2.59 |
33.86 |
33.39 |
1.42 |
|
Dexus |
Office |
9.51 |
11.03 |
5.80 |
10.42 |
1.21 |
27.29 |
40.31 |
1.41 |
|
Mirvac Group |
Diversified |
9.46 |
9.85 |
5.80 |
11.35 |
1.24 |
22.33 |
42.06 |
1.50 |
|
GPT Group |
Diversified |
9.55 |
8.29 |
6.90 |
11.95 |
0.96 |
17.13 |
56.51 |
1.40 |
|
Scentre Group |
Retail |
10.18 |
13.07 |
10.70 |
17.17 |
0.86 |
15.89 |
101.35 |
1.71 |
|
Vicinity Centres |
Retail |
9.50 |
5.01 |
11.70 |
27.10 |
0.80 |
14.20 |
175.88 |
1.47 |
|
Stockland |
Diversified |
8.44 |
7.40 |
10.50 |
32.20 |
1.01 |
25.38 |
213.13 |
1.99 |
|
Charter Hall Group |
Diversified |
8.33 |
3.81 |
5.50 |
21.44 |
2.64 |
26.22 |
66.71 |
1.30 |
|
Shopping Centres Australasia Property Group |
Retail |
6.04 |
2.59 |
6.90 |
18.94 |
1.05 |
17.30 |
116.48 |
1.60 |
|
Charter Hall Long WALE REIT |
Diversified |
5.11 |
1.94 |
7.00 |
18.95 |
1.22 |
20.70 |
101.62 |
1.44 |
|
Cromwell Property Group |
Office |
4.14 |
1.61 |
10.00 |
15.32 |
1.18 |
18.23 |
96.00 |
1.69 |
|
Abacus Property Group |
Diversified |
2.75 |
1.00 |
7.90 |
11.73 |
1.21 |
21.80 |
52.93 |
1.45 |
Source: Factset, 30 April 2020
See how MVA has outperformed.
For those investors looking to diversify offshore in global REITs, VanEck Vectors FTSE International Property (Hedged) ETF (ASX: REIT) gives one trade access to 300 REITs listed on international exchanges.
IMPORTANT NOTICE: This information is issued by VanEck Investments Limited ABN 22 146 596 116 AFSL 416755 (‘VanEck’) as responsible entity and issuer of the VanEck Vectors Australian Property ETF and VanEck Vectors FTSE International Property (Hedged) ETF (‘Funds’). Nothing in this content is a solicitation to buy or an offer to sell shares of any investment in any jurisdiction including where the offer or solicitation would be unlawful under the securities laws of such jurisdiction. This is only general advice about a financial product and not personal advice. It is intended for use by financial services professionals. It does not take into account any person’s individual objectives, financial situation or needs. Before making an investment decision in relation to the Funds, you should read the PDS and with the assistance of a financial adviser consider if it is appropriate for your circumstances. The PDS is available at www.vaneck.com.au or by calling 1300 68 38 37. The Funds are subject to investment risk, including possible loss of capital invested. Past performance is not a reliable indicator of future performance. No member of the VanEck group of companies gives any guarantee or assurance as to the repayment of capital, the payment of income, the performance, or any particular rate of return from the Funds.


Published: 11 May 2020