Expert analysis: Taking a Value approach
International investing has both inspired Australian investors in allocating their wealth to household names such as Intel, IBM and Pfizer but also diversified their portfolios to the economic and sector opportunities underrepresented in Australia. Here we provide some insightful analysis for our popular International Value ETF (VLUE) versus the international equity benchmark.
Australian investors have been investing offshore for some time and the rise of ETFs has increased the opportunity set and further opened the investment landscape. Investing internationally makes sense. The size of the ASX is less than 2% of total assets invested on exchanges globally. No investor should be missing out on the 98% of opportunities. Some of these opportunities include companies like Intel, IBM and Pfizer. These are all household names but for Australian investors looking to access their growth, these investment propositions have not been readily available on the ASX.
In addition to accessing companies not listed on ASX, investing offshore also gives exposures to sectors underrepresented in Australia such as healthcare and technology. But not all companies are desirable from an investment point of view. Importantly when investing offshore there are other risks to consider such as currency, geo-political, economic, market and sector risks.
To date there has only been two popular approaches to investing in international equities:
- Via an actively managed fund; or
- Via a passive fund tracking the benchmark index.
When actively managed funds were first offered to investors, performance was uncertain and the costs were high. Sometimes the returns were good, but often they were not. Many people found this a poor bargain and moved to lower cost passive funds that tracked traditional indices. In these new funds, returns could be thought of as average - not high, not low, just the market average. When it comes to international investing in a passive fund, the widely used benchmark is the MSCI World ex Australia Index, for ease of reading let’s call it the International Equity Index. Innovations in index design for passive funds are delivering above market benchmark returns over the long term while retaining low costs. It is this approach VanEck offers in international equities and it is being used by savvy investors as a substitute for both.
At VanEck we have offered investors opportunities to diversify offshore since 1956. Our approach is synonymous with investing great’s Benjamin Graham and his student Warren Buffett’s investment philosophies. Benjamin Graham is known as the father of ‘value investing’ and he wrote what is considered one of the world’s best investing almanacs “The Intelligent Investor”. Central to Graham’s philosophy is his belief that believed undervalued companies have the capability to perform well in the long run. He believed that you should always invest with a “margin of safety”. The “margin of safety” is the principle of buying a security at a significant discount to its intrinsic value.
This investing concept became known as value investing and since Graham wrote his book in 1949, value investing has not changed. Buying companies currently trading, at what is believed to be, a discount to their fair value is an approach that has been used successfully. Value investing has historically outperformed over the long term. Our international Value ETF (VLUE) tracks the MSCI World ex Australia Enhanced Value Top 250 Select Index. MSCI’s Enhanced Value Index applies three valuation ratio descriptors on a sector relative basis:
- price-to-book value;
- price-to-forward earnings; and
- enterprise value-to-cash flow from operations.
Compared to a traditional value approach, MSCI’s enhanced value overcomes many of the criticisms of value because it puts less weight on price-to-book as a metric and moves away from backward-looking dividend yield altogether. It uses a whole-firm valuation measure in enterprise value that could reduce concentration in leveraged companies. It also employs a sector neutral approach that MSCI found mitigates some of the drawdown inherent with the value investing style.
So let’s walk through the difference between VLUE and its index and the International Equity Index.
VLUE vs International Equity Index – Fundamentals
Table 1: Statistics and fundamentals
|
|
VLUE |
MSCI World ex Australia |
|
Index strategy |
Smart beta – value |
Market capitalisation weight |
|
Number of countries |
18 |
22 |
|
Number of sectors |
11 |
11 |
|
Number of holdings |
250 |
1484 |
|
12mth trailing Dividend Yield |
2.87% |
1.66% |
|
Dividend frequency |
Annually |
- |
|
Price to book (x) |
1.21 |
3.03 |
|
Price to earnings (x) |
11.3 |
20.4 |
|
Price to cash flow (x) |
6.47 |
15.16 |
Source: FactSet as at 21 Jan 2022. Past performance is not a reliable indicator of future performance. You cannot invest directly in an index.
As you would expect, VLUE has lower price to book, price to earnings and price to cash flow. As is typical of value strategies, VLUE has a higher dividend. This is because, on average, value companies tend to be more mature as opposed to many growth companies that do not yet have dividends.
VLUE vs International Equity Index - Performance
You may have seen in the news that there has been a rotation to ‘value’ stocks in response to higher inflation and potentially higher interest rates. It is worthwhile noting that the recent outperformance is not an historical aberration. Since the turn of the century, the value factor has outperformed the MSCI World ex Australia Index, despite its ‘lost decade’ after the GFC.
Based on back testing, the index VLUE tracks (net of VLUE’s 0.40% p.a. management costs) displays strong long-term performance since its inception, as highlighted by the chart below.
1: Modelled cumulative performance: VLUE’s index1after fees 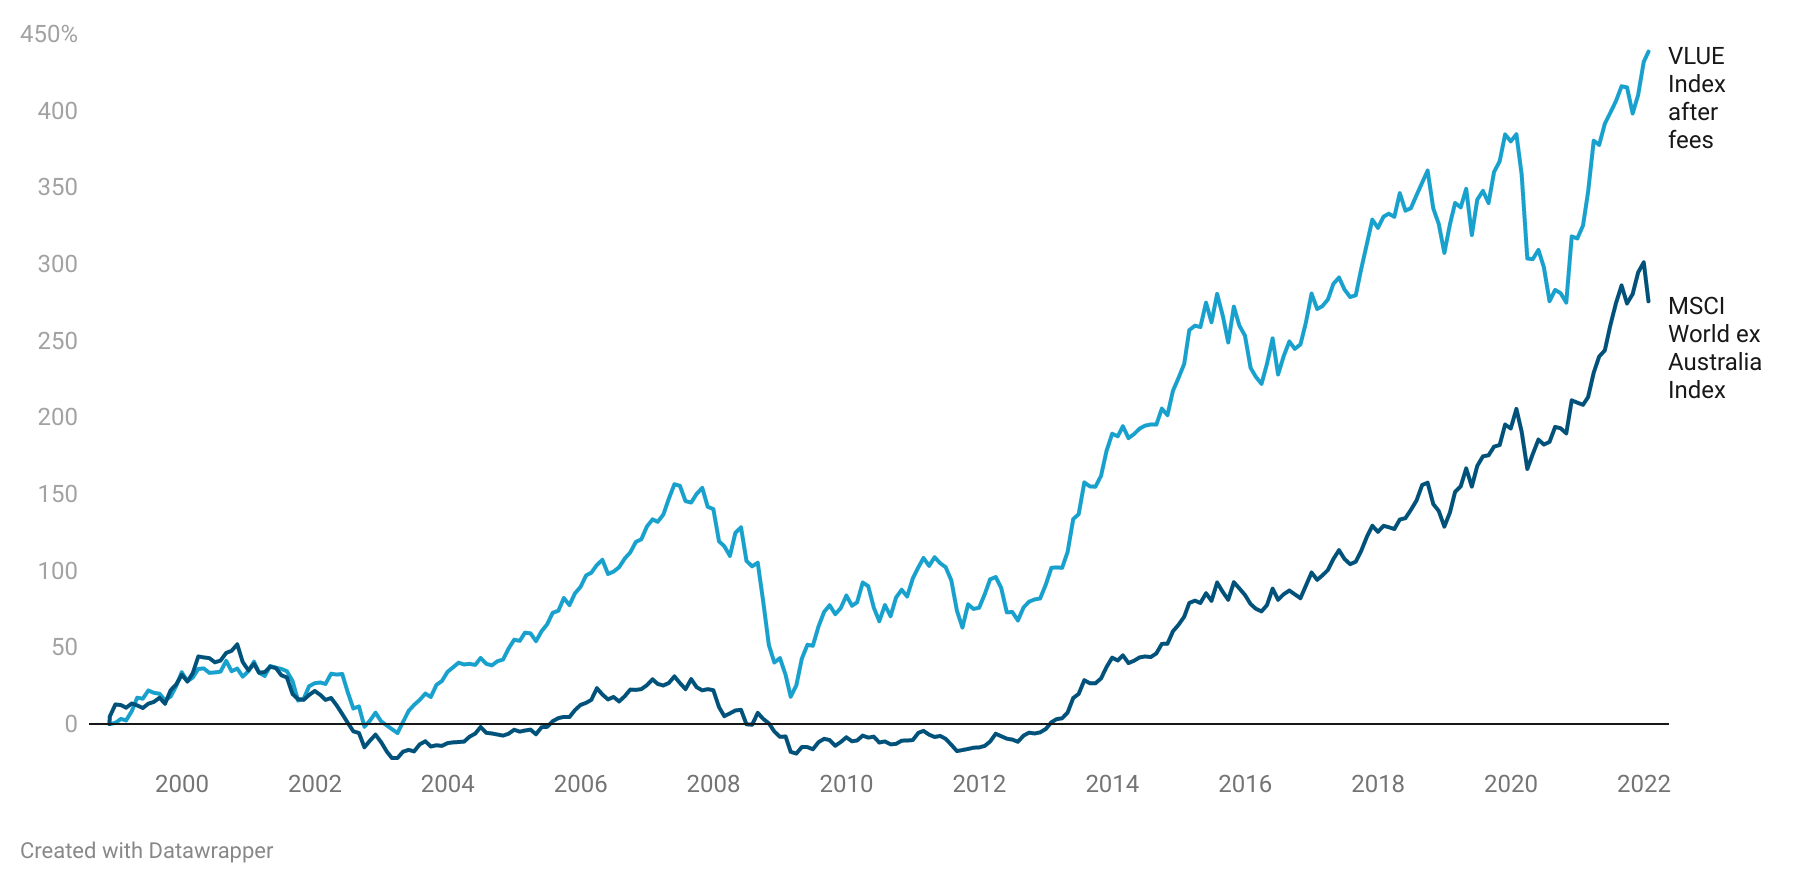
Table 2: Trailing returns
Performance as at 25 January 2022
|
MTD (%) |
1 Month (%) |
3 Months (%) |
6 Months (%) |
Since VLUE inception date2 (%) |
1 Year (% p.a.) |
3 Years (% p.a.) |
5 years |
10 years |
20 years |
Since VLUE Index base date1 (% p.a.) |
|
|
VLUE |
1.22 |
1.38 |
7.00 |
7.69 |
15.99 |
|
|
|
|
|
|
|
VLUE Index (net of mgmt costs)1 |
|
|
|
|
|
23.93 |
7.68 |
7.42 |
11.17 |
7.48 |
7.54 |
|
MSCI World ex Australia Index3 |
-6.19 |
-5.89 |
-0.81 |
0.55 |
19.17 |
18.42 |
16.33 |
13.88 |
15.74 |
5.81 |
5.68 |
Chart 5 and Table 2 Source: VanEck, Morningstar, Bloomberg as at 25 January 2022. Past performance is not a reliable indicator of future performance.
1VLUE Index results are net of VLUE’s 0.40% p.a. management costs, calculated daily but do not include brokerage costs or buy/sell spreads of investing in VLUE. You cannot invest in an index. VLUE’s Index base date is calculated at 30 November 1998. VLUE Index performance prior to its launch on 15 February 2021 is simulated.
2 VLUE inception date is 8 March 2021 and a copy of the factsheet is here.
3 The MSCI World ex Australia Index (“MSCI World ex Aus”) is shown for comparison purposes as it is the widely recognised benchmark used to measure the performance of developed market large- and mid-cap companies, weighted by market capitalisation. VLUE’s index measures the performance of 250 international large- and mid-cap companies selected from the MSCI World ex Australia Index with high value scores relative to their peers at rebalance. Exclusions apply for weapons and tobacco. Consequently VLUE’s index has fewer companies and different country and industry allocations than MSCI World ex Aus. Click here for more details.
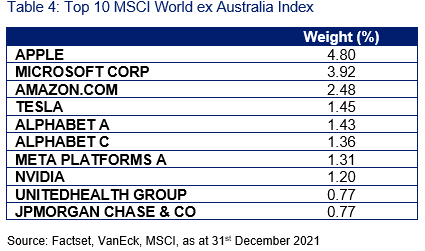
VLUE vs International Equity Index - Top 10 holdings
Below you can see the top 10 companies. The top 10 holdings are companies that investors can relate to in their day-to-day lives – to see all the holdings in VLUE and their weightings click here. 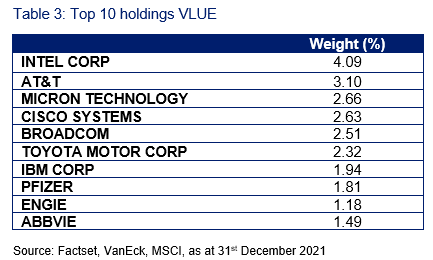
VLUE vs International Equity Index - Style
When looking at portfolios it is important to determine what style eg value or growth and what size bias a portfolio holds eg giant, large, mid or small. Below we can see VLUE’s. Importantly VLUE holds large companies with a value- orientation relative to the International Equity Index.
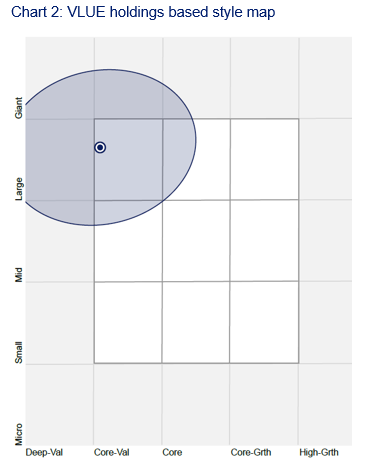
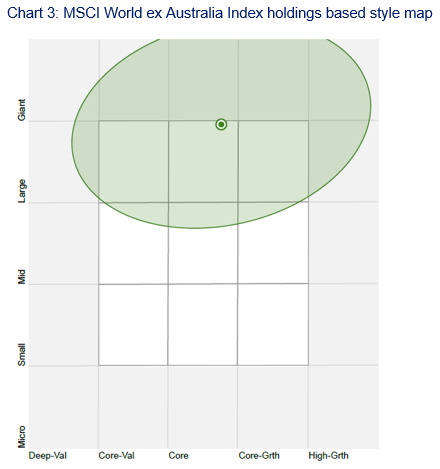
Source: Morningstar Direct, as at 31stDecember 2021
While each International Equity ETF has its merit for portfolio inclusion, you should assess all the risks and consider your investment objectives.
Past performance is no guarantee of future performance. The above is not a recommendation. Please speak to your financial adviser or stock broker.
For further information, email or contact us at +61 2 8038 3300.
Key risks
An investment VLUE carries risks associated with: ASX trading time differences, financial markets generally, individual company management, industry sectors, foreign currency, country or sector concentration, political, regulatory and tax risks, fund operations and tracking an index. See the PDS for details.


Published: 28 January 2022
Any views expressed are opinions of the author at the time of writing and is not a recommendation to act.
VLUE is indexed to a MSCI index. VLUE is not sponsored, endorsed or promoted by MSCI, and MSCI bears no liability with respect to VLUE or the MSCI Index. The PDS contains a more detailed description of the limited relationship MSCI has with VanEck and VLUE.