Value rotation on the radar
The foundation of Value investing is the notion that cheaply priced stocks outperform pricier stocks in the long term.
Value companies are typically determined by selecting those with the lowest price fundamentals, such as price to earnings, relative to peers.
The foundation of Value investing is the notion that cheaply priced stocks outperform pricier stocks in the long term.
Value companies are typically determined by selecting those with the lowest price fundamentals, such as price to earnings, relative to peers.
Value is categorised as a “pro-cyclical” factor, meaning it has tended to benefit during periods of economic expansion. In addition, Value and Growth active returns are negatively correlated. In other words, when Value outperforms Growth underperforms and vice versa.
State of play
Widely considered the market benchmark, the MSCI World Growth Index has consistently outperformed its Value equivalent since the 2008 Global Financial Crisis (see Chart 1). When the line is going up, Value is exceeding Growth.
In recent months, changes in macro signals bode well for a potential Value rotation. Value outperformed growth by 8.31% in AUD terms over 6 months to 28 Feb 2021.
Chart 1 – Cumulative performance of MSCI World Value Index relative to MSCI World Growth Index since 1975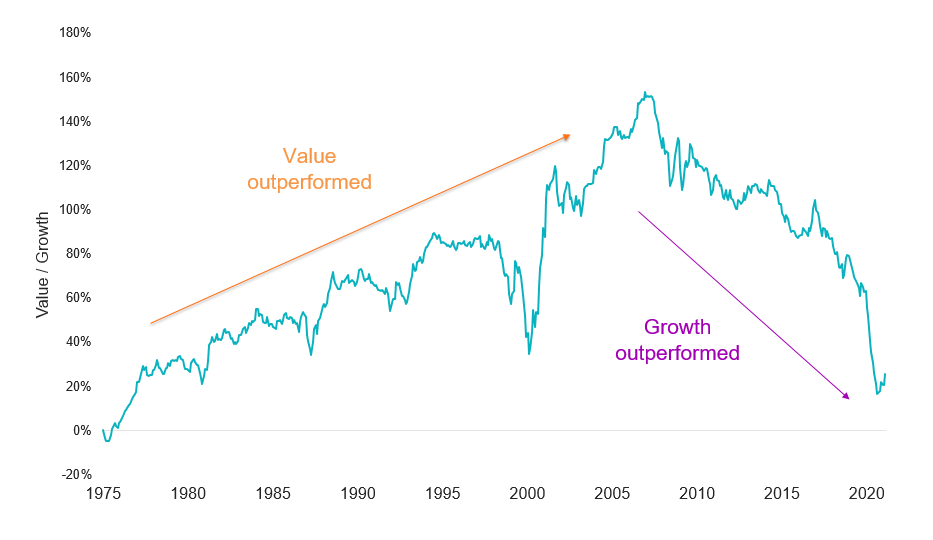
Source: Bloomberg
Value macro signals
1. Dispersion between Value and Growth valuations is the highest in 20 years
MSCI World Growth 12-month forward price to earnings ("PE") valuations are near 2000 dot com bubble highs (Chart 2). MSCI World Value price to book ("PB") relative to growth is at a 25-year low (Chart 3).
Chart 2 and 3 – MSCI World Growth and Value valuation comparisons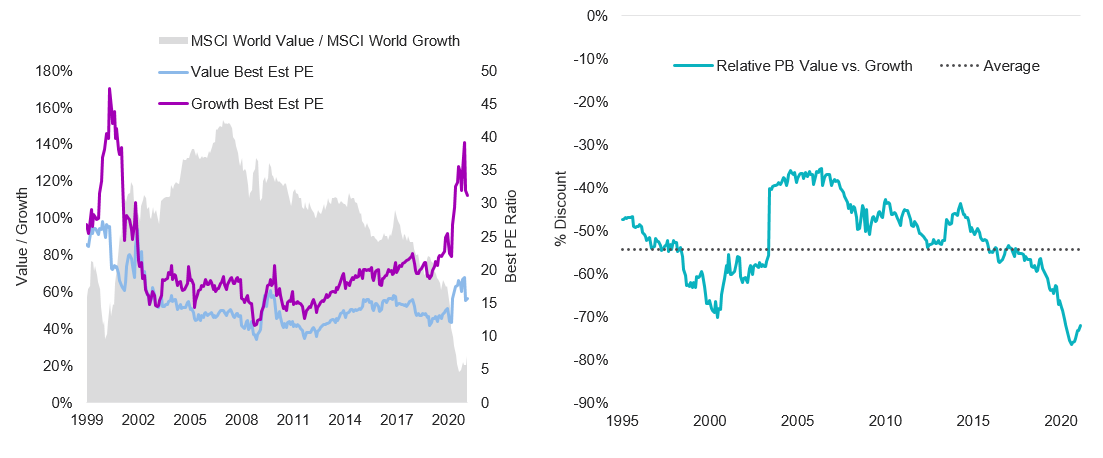
Source: Bloomberg
2. Value stocks led the equity markets recovery after the previous 14 US recessions
Markets anticipate a strong global economic recovery in 2021 supported by the COVID-19 vaccine rollout, government and central bank expansionary measures.
Table 1 - Relative returns of Value versus S&P 500 after recessions, 1929 to 2009
|
|
|
||||
|
Recession peak |
Recession trough |
Start of recovery |
End of recovery |
# Months of recovery |
Performance of Value vs S&P 500 |
|
August 1929 |
March 1933 |
May 1932 |
August 1932 |
3 |
+78.3 |
|
May 1937 |
June 1938 |
May 1940 |
July 1941 |
14 |
+33.0 |
|
February 1945 |
October 1945 |
August 1945 |
November 1945 |
3 |
+11.1 |
|
November 1948 |
October 1949 |
March 1950 |
January 1951 |
10 |
+29.7 |
|
July 1953 |
May 1954 |
December 1953 |
August 1955 |
20 |
+25.9 |
|
August 1957 |
April 1958 |
December 1957 |
September 1959 |
21 |
+39.3 |
|
April 1960 |
February 1961 |
June 1960 |
May 1961 |
11 |
+9.8 |
|
December 1969 |
November 1970 |
December 1969 |
August 1970 |
8 |
+9.0 |
|
November 1973 |
March 1975 |
November 1974 |
February 1976 |
15 |
+38.2 |
|
January 1980 |
July 1980 |
November 1980 |
September 1982 |
22 |
+45.1 |
|
July 1981 |
November 1982 |
June 1983 |
November 1984 |
17 |
+23.0 |
|
July 1990 |
March 1991 |
December 1991 |
June 1992 |
6 |
+18.1 |
|
March 2001 |
November 2001 |
October 2001 |
June 2002 |
8 |
+10.3 |
|
December 2007 |
June 2009 |
February 2009 |
April 2010 |
14 |
+25.9 |
Source: BofA US Equity & Quant Strategy, Dartmouth University Data Library, Bloomberg S&P 500 comparison used due to data availability. Peak and trough dates from NBER.
3. Higher inflation and yields have historically been better for Value
Inflationary expectations have sharply improved since Q2 2020 reaching 5-year highs. A high inflation environment supports Value valuations relative to Growth (Chart 4) and puts upward pressure on long dated bond yields, a reflection of early economic cycle expansion (Chart 5).
Chart 4 : US inflation rate market expectations is rising | Chart 5: Rising yields is a leading indicator for economic recovery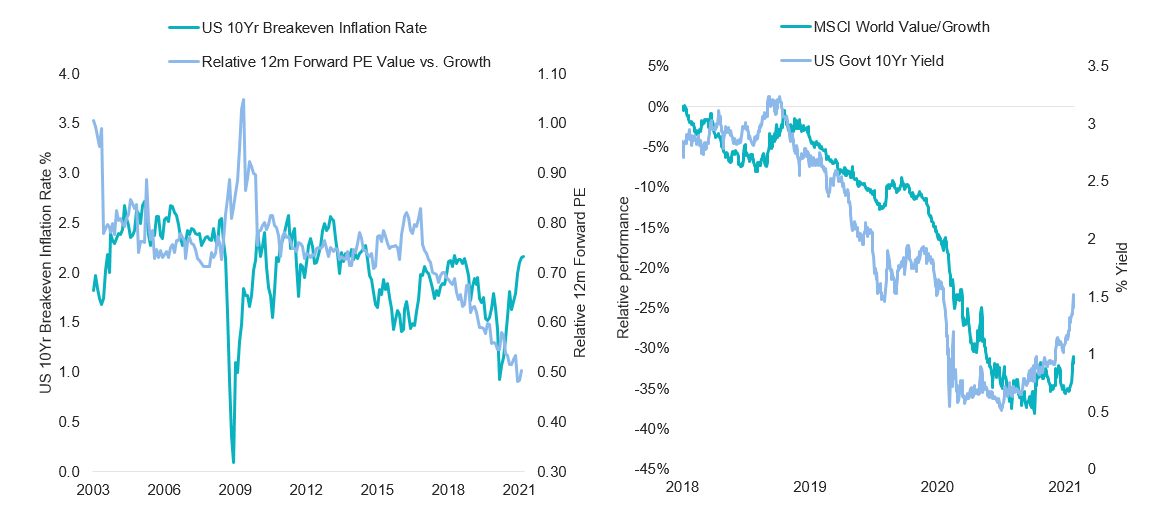
Source: Bloomberg
Accessing international Value companies
VanEck is this week launching Australia’s first smart beta international equities value ETF on the ASX in partnership with leading index provider MSCI. The VanEck Vectors MSCI International Value ETF (ASX: VLUE) will invest in approximately 250 international companies selected for their higher value characteristics relative to sector peers.
Related Insights


Published: 05 March 2021
VLUE is indexed to a MSCI index. VLUE is not sponsored, endorsed or promoted by MSCI, and MSCI bears no liability with respect to VLUE or the MSCI World ex Australia Enhanced Value Top 250 Select Index. The PDS contains a more detailed description of the limited relationship MSCI has with VanEck and VLUE.
© 2021 Van Eck Associates Corporation. All rights reserved.