VanEck Australian ETF Review – Half Year 2020
After a strong start to the year with a record January, things quickly took a turn for the worse in what will be remembered as one of the most volatile six-month periods in history. However the Australian ETF industry remained resilient as investors turned to exchange traded products (ETPs) to end the first half of 2020 with record inflows.
Industry size: Despite record numbers, the ETP industry grew at a relatively subdued rate of ~6% due to decline in asset values ending the half year at $65.6bn, slightly below the all-time high $66bn achieved at the end of January. In absolute terms, the industry grew ~$4bn which can be entirely attributed to net inflows. 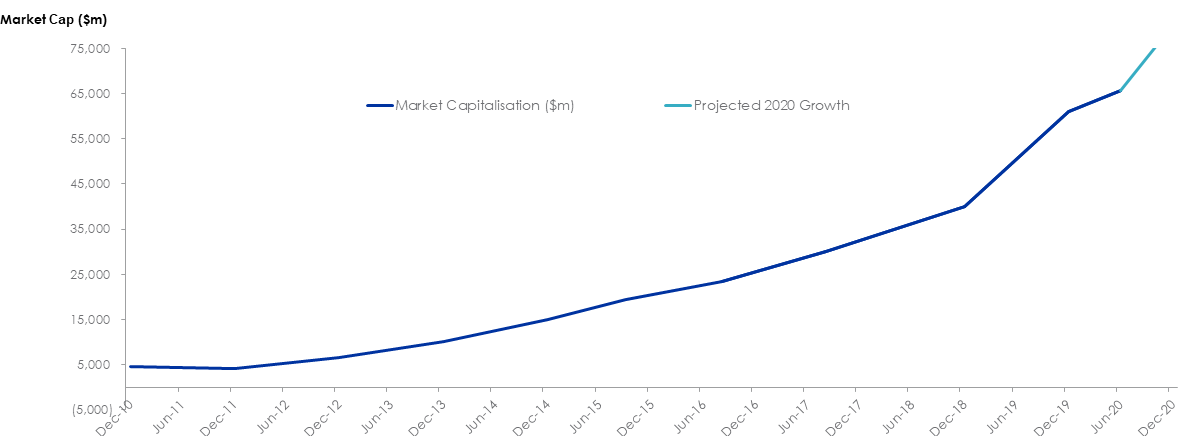
Net flows: The industry saw net new money of $8.2bn to the end of June, which is an increase of 90% compared to pcp and an increase of 300% compared to first half 2018.
Product launches: After a relatively quiet first quarter with only 3 new product launches, the half year ended with 9 product launches in total. Notably, there were two ETF issuers that exited the market as UBS converted 6 of their products in May and Pinnacle liquidated their 2aShares products in June. There are now 212 ETPs listed across 23 issuers in an increasingly competitive industry.
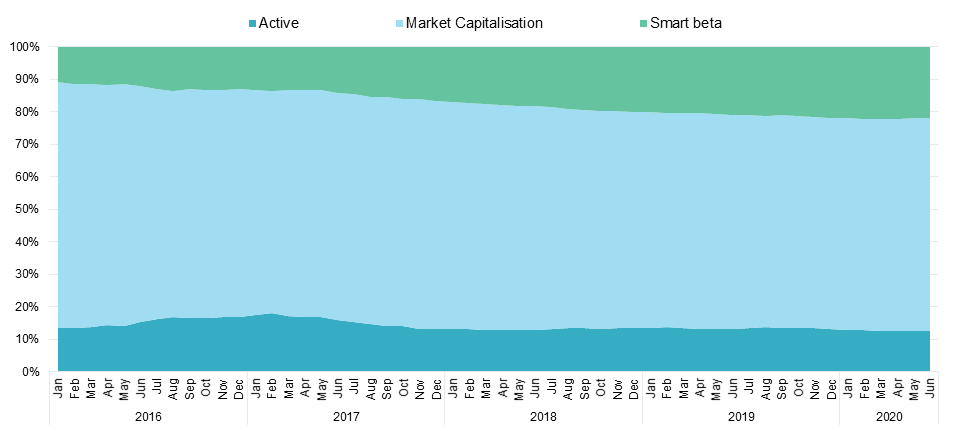
Flows by strategy type: Market capitalisation products continue to take the lion’s share of flows making up 56% of net flows for the first half as smart beta products and gold/leverage and inverse products received 16% and 22% of industry flows respectively. Smart beta products continue to be the fastest growing strategy type in the Australian ETP industry growing their market share by 32%, 42% and 48% over 1, 2 and 3 years respectively.|
Strategy |
Net Flows YTD ($m) |
|
Active |
504.8 |
|
Other |
1,828.6 |
|
Market Capitalisation |
4,584.0 |
|
Smart beta |
1,281.3 |
Cumulative net flows by strategy
Source: ASX, as at 30 June 2020
Flows by asset class: The first half of the year saw a complete overhaul of the asset class flows composition compared to 2019. Some notable observations include:
- Equity made up almost 70% of the total net flows with Australian equity in particular more than doubling its market share and over 1.5x the flows of the next largest asset class, international equities.
- Conversely, fixed income saw a sharp decline from 30% of market share in 2019 to 3% after recording net outflows from February to June.
- There was also significantly more flows going into leveraged & inverse and gold bullion products, increasing by 660% and 141% respectively.
|
Asset class |
Net Flows YTD ($m) |
|
Australian Equity |
3,647.9 |
|
International Equity |
2,029.5 |
|
Commodity |
928.5 |
|
Leveraged & Inverse |
853.1 |
|
Asset Allocation |
242.3 |
|
Australian Fixed Income |
202.4 |
|
Cash |
174.3 |
|
International Fixed Income |
73.6 |
|
Currency |
47.0 |
|
Asset class |
2020 YTD (%) |
2019 YTD (%) |
|
Australian Equity |
44.49% |
24.67% |
|
International Equity |
24.75% |
31.98% |
|
Australian Fixed Income |
2.47% |
25.52% |
|
Commodity |
11.33% |
8.26% |
|
Cash |
2.13% |
-0.17% |
|
International Fixed Income |
0.90% |
4.76% |
|
Asset Allocation |
2.96% |
3.76% |
|
Leveraged & Inverse |
10.40% |
2.40% |
|
Currency |
0.57% |
-1.18% |


Published: 21 July 2020
General information only: This information is believed to be accurate at the time of compilation but is subject to change. VanEck does not represent or warrant the quality, accuracy, reliability, timeliness or completeness of the information. To the extent permitted by law, VanEck does not accept any liability (whether arising in contract, tort, negligence or otherwise) for any error or omission in the information or for any loss or damage (whether direct, indirect, consequential or otherwise) suffered by any recipient of the information, acting in reliance on it. The funds are subject to investment risk, including possible loss of capital invested. Past performance is not a reliable indicator of future performance. No member of the VanEck group guarantees the repayment of capital, the payment of income, performance, or any particular rate of return from the fund.