Portfolio considerations for rising inflation
The changing macroeconomic environment has led many investors to assess how they are positioned.
The changing macroeconomic environment has led many investors to assess how they are positioned.
Inflation Signals
Inflation expectations have reached the highest level since 2008 following unprecedented government and central bank stimulus, driving the economic global recovery in response to COVID-19 (chart 1). A year ago, any hint of developed markets maintaining steady inflation was met with scrutiny. However, the tide looks to be turning and the central banks might finally be getting a sniff of what they have been craving for so long. The rapid change in sentiment is largely a product of surging global commodity prices, a leading indicator for inflation as shown in chart 2.
Chart 1 & 2 – US 5 Year Breakeven Inflation | US CPI versus commodity spot prices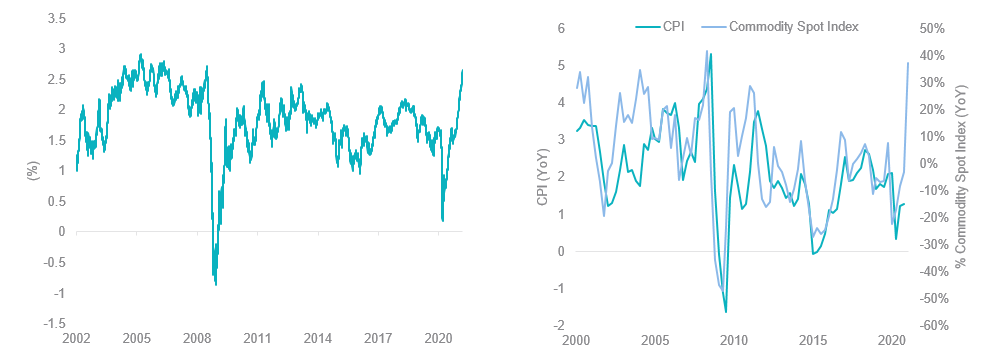
Source: Bloomberg. CPI As US CPI, Commodity Spot Index As Bloomberg Commodity Spot Index.
In response, long-dated government bond yields have risen to pre-pandemic levels in anticipation of future interest rate rises in order for central banks to curb inflation (chart 3).
Chart 3 – Australian & USA 10 year government bond yields
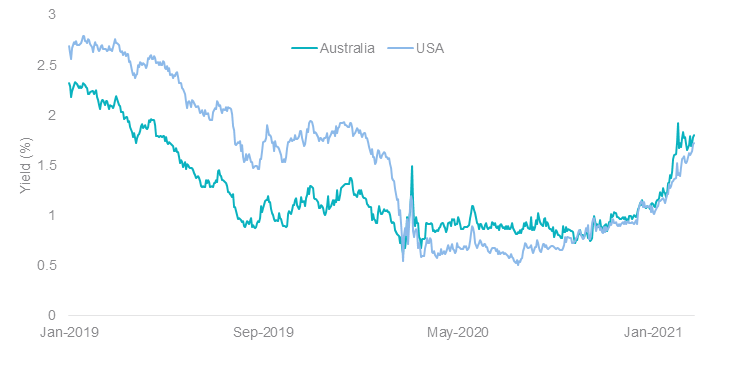
Source: Bloomberg
However, this signal is contrary to that of both US and Australian central bank policy makers with RBA governor Philip Lowe stating that interest rates are “very likely to remain at its current level until at least 2024”. The RBA governor commented that for interest rates to increase, “wages growth will have to be materially higher than that is currently” which “will require significant gains in employment and a return to a tight labour market”. Chart 4 illustrates the negative correlation between changing consumer price index (CPI) and unemployment rates. The correlation between the two items has reduced over decades.
Chart 4 – US unemployment rate change versus CPI
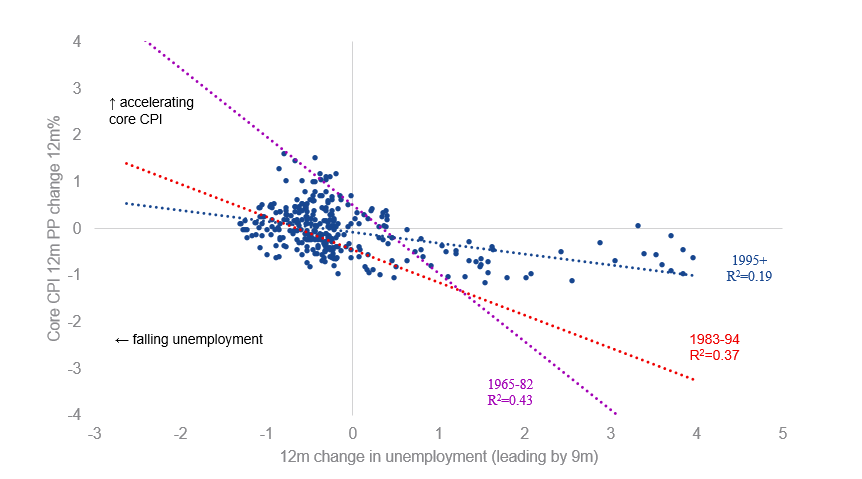
Source: BLS. Observations between 1965 and 1994 are not shown.
How has changing inflation expectations affected equity investments?
Modest inflation can improve the relative attractiveness of certain investments as discussed in more detail below.
Commodities and resource equities
Inflation is a product of higher raw material costs such as oil, coal and iron ore. Higher commodity prices ultimately benefit companies in mining resources as shown in chart 5.
Chart 5 – Commodity & equity 12 month returns relative to MSCI World by CPI band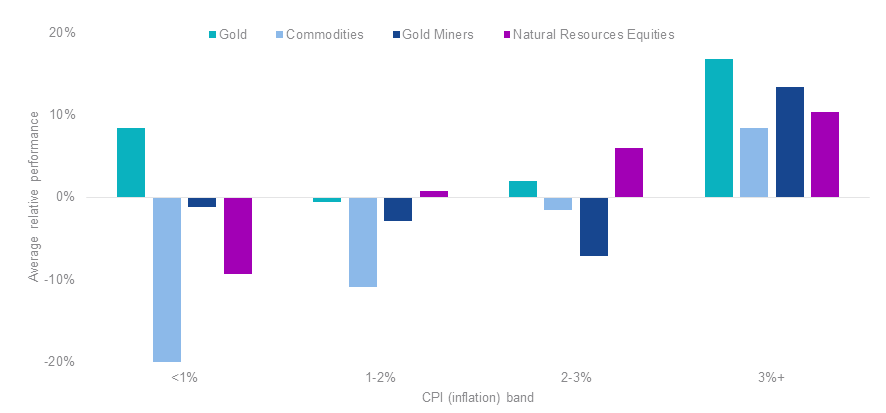
Source: Bloomberg. Quarterly 12-month average rolling performance between January 2000 and December 2020. Gold as Gold LBMA PM spot price, Commodities as Bloomberg Commodity Spot Index, Gold Miners as NYSE Arca Gold Miners, Resource Equities as MSCI World Materials Index. You cannot invest directly in an index. Past performance is not a reliable indicator of future results.
Factors
Growth stocks have benefited from falling interest rates which has resulted in reduced borrowing costs, boosting profits and valuations. Value stocks are less sensitive to changes in macroeconomic conditions, which tend to lead to outperformance during higher inflation periods.
Chart 6 – MSCI World factor relative 12 month returns by CPI band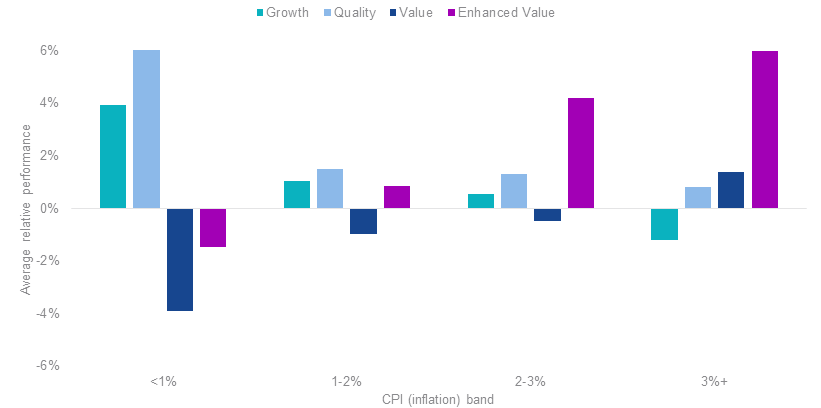
Source: Bloomberg. Quarterly 12-month average rolling performance between January 2000 and December 2020. Indexes are all MSCI World Factor Indexes. You cannot invest directly in an index. Past performance is not indicative of future results.
Sectors
A number of sectors are widely considered to provide an element of protection against inflation, notably energy, materials, utilities, real estate (REITs) and infrastructure.
Real estate – Property and rental income tend to rise when inflation rises.
Infrastructure – Most infrastructure assets have an explicit link to inflation through concession agreements, regulations or contracts. For example, road tolls typically increase at maximum of CPI or specified fixed rate.
Energy and utilities – Water, electricity and gas utilities often pegged to inflation through regulated pricing.
Chart 7 – MSCI World GICS Sector & FTSE Infrastructure 12 month relative returns by CPI band
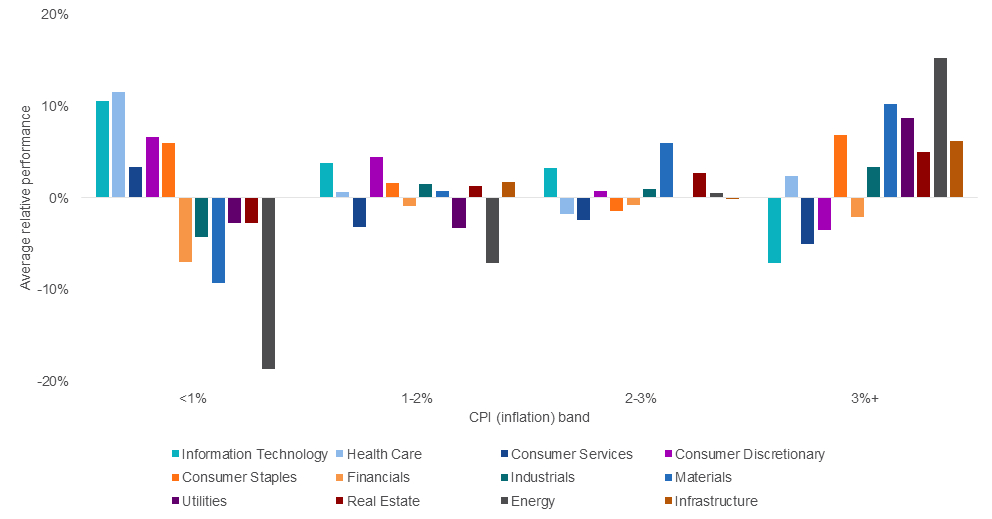
Source: Bloomberg. Quarterly 12-month average rolling performance between January 2000 and December 2020. Indexes are all MSCI World Sector Indexes except Infrastructure. Infrastructure as FTSE Developed Core Infrastructure 50/50 Index. You cannot invest directly in an index. Past performance is not a reliable indicator of future results.
Access to investment opportunities
Exchange Traded Funds (ETFs) allow investors to take sector and factor positions in a single trade.
VanEck offers 28 ASX listed ETFs that provide investors with:
• opportunities to asset classes often underrepresented in investor portfolios; or
• beyond-the-usual approaches to established investment categories


Published: 06 April 2021
VanEck Investments Limited ACN 146 596 116 AFSL 416755 (‘VanEck’) is the responsible entity and issuer of units in VanEck ETFs. This is general advice only, not personal financial advice. It does not take into account any person’s individual objectives, financial situation or needs. Read the PDS and speak with a financial adviser to determine if a fund is appropriate for your circumstances.