Interesting April provides insight on gold market
Gold’s positive momentum continued in April. Bullion gained 1.52%, driven primarily by weaker than expected US economic data, while gold equities underperformed.
Weaker US dollar, investment demand sustains gold's momentum in April
Gold's positive momentum continued in April. Bullion traded as high as US$1,289.60 per ounce on 18 April, driven primarily by weaker than expected US economic data. Most notably, figures released in the US jobs report were below expectations. US Factory output also surprised on the downside. Gold also gained support from comments by President Trump, during an interview on 12 April, in which he stated that the US dollar was getting too strong and that he would prefer that the Fed keep interest rates low. By 18 April, markets were not pricing in another Fed rate hike in June, with the implied probability at only 43.7%. However in the last week of April markets perceived the outcome of the first round of the French presidential elections positively, fuelling risk-on sentiment and pushing down the price of gold. As of 1 May, markets were attaching a ~70% probability to a June Fed rate hike and a 72% probability to a July hike. Gold ended April at US$1,264 per ounce, up US$18.94 or 1.52%.
Gold stocks display rare behaviour relative to bullion
Gold stocks underperformed the metal, which is uncharacteristic for a
period in which the price of gold increased. The NYSE Arca Gold Miners Index (GDX
Index) was flat during the month.
The underperformance was driven by a 12% drop in the share price of Barrick Gold. On 24 April, Barrick reported 1Q 2017 results that missed expectations, primarily due to operational issues that the company expects to resolve shortly. However this was received very negatively by markets, which have become accustomed to Barrick consistently meeting or exceeding expectations. Although there were a few other negative surprises, overall, the seniors and mid-tier companies reported 1Q results that met or exceeded expectations.
Gold equities should outperform gold bullion during rising gold prices and underperform if gold prices fall. Although this expected relative performance may not hold during certain periods (as was the case in April), gold equities have consistently demonstrated their effectiveness as leverage plays on gold during the past several years as shown in this chart.
Gold Stocks Typically Provide Leverage to Bullion
2012-2017
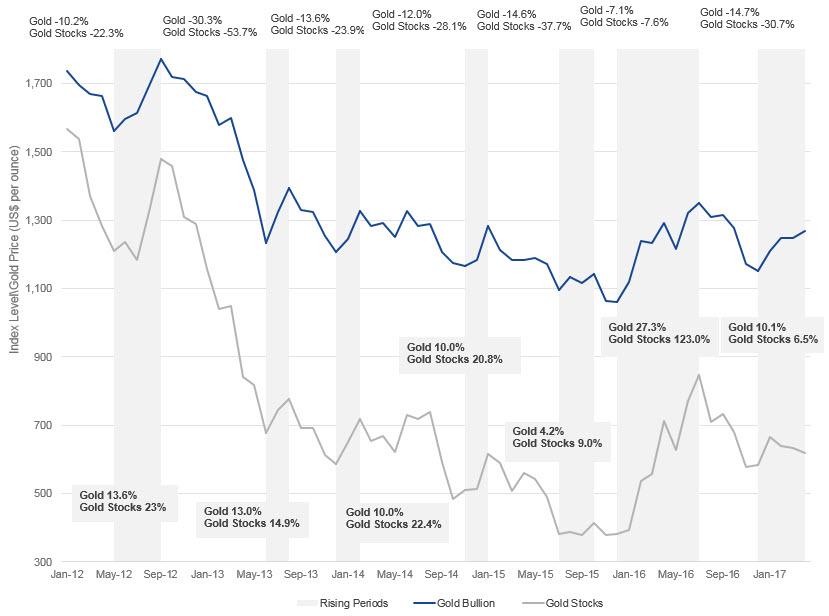
Source: Bloomberg. As of April 28, 2017. Past performance is not indicative of future results.
Gold market in April provides insight for 2017 and beyond
It is conceivable that the gold market for the year 2017 may end up looking like it did in April which was characterised by short rallies followed by pullbacks, as the market's assessment of the health and prospects of the US economy and the Fed's rate outlook lifts or depresses the gold price. We see the gold price well supported within a range centred on the US$1,250 per ounce level in 2017, as it establishes a new base that started forming in 2016. There is potentially significant risk and uncertainty that could drive the gold price higher, and it certainly seems possible that the geopolitical or financial outlook could turn negative rather quickly. Beyond 2017, adverse events, we believe, become increasingly likely as the post-crisis expansion ages especially if the bull market in stocks and bonds loses steam. These are the types of "risk-off" events that we believe will likely compel investors to seek protection by investing in gold and gold equities.
Gold stocks typically provide leverage to gold and current valuations remain attractive
Gold mining equities offer leveraged exposure to gold. The leverage comes from earnings leverage; as the gold price increases, the change in the company's profitability significantly outpaces the change in the gold price. In addition, at higher gold prices, in-the-ground resources have a higher value, and the company's exploration efforts, project expansions, operational improvements, and potential acquisitions also become more valuable. This explains why gold stocks trade at premium valuation multiples. Looking at historical valuation levels, as illustrated by the price-to-cash flow chart below, we see that stocks are currently trading at multiples that are below the long-term average, and well below the multiples reached during the peak of the last bull market.
Historic Price-to-Cash Flow of Gold Majors and Mid-Tiers
2006-2017
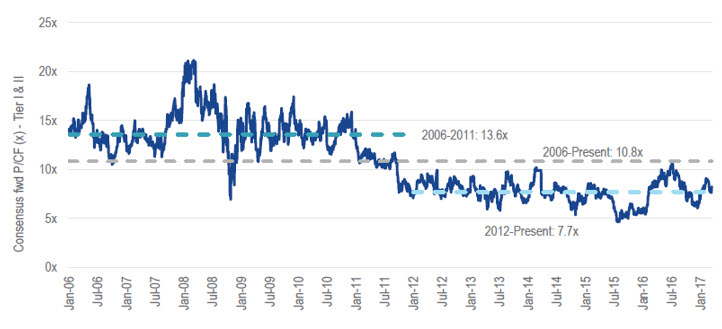
Source: RBC Capital Markets. Data as of March 17, 2017. Past performance is not indicative of future results.
IMPORTANT NOTICE: Issued by VanEck Investments Limited ABN 22 146 596 116 AFSL 416755 (‘VanEck’). VanEck is a wholly owned subsidiary of Van Eck Associates Corporation based in New York, United States. VanEck Vectors ETF Trust ARBN 604 339 808 (the ‘Trust’) is the issuer of shares in the VanEck Vectors Gold Miners ETF (‘US Fund’). The Trust and the US Fund are regulated by US laws which differ from Australian laws. Trading in the US Fund’s shares on ASX will be settled by CHESS Depositary Interests (‘CDIs’) which are also issued by the Trust. The Trust is organised in the State of Delaware, US. Liability of investors is limited. VanEck Associates serves as the investment adviser to the US Fund. VanEck, on behalf of the Trust, is the authorised intermediary for the offering of CDIs over the US Fund’s shares and issuer in respect of the CDIs and corresponding Fund’s shares traded on ASX.
This is general information only and not financial advice. It does not take into account any person’s individual objectives, financial situation or needs. Investing in international markets has specific risks that are in addition to the typical risks associated with investing in the Australian market. These include currency/foreign exchange fluctuations, ASX trading time differences and changes in foreign regulatory and tax regulations. Before making an investment decision in relation to the US Fund you should read the PDS and with the assistance of a financial adviser consider if it is appropriate for your circumstances. The PDS is available at www.vaneck.com.auor by calling 1300 68 38 37.
Past performance is not a reliable indicator of future performance. No member of the VanEck group of companies or the Trust gives any guarantee or assurance as to the repayment of capital, the payment of income, the performance or any particular rate of return from the US Fund.
An investment in the US Fund may be subject to risks that include, among others, competitive pressures, dependency on the price of gold and silver bullion that may fluctuate substantially over short periods of time, periods of outperformance and underperformance of traditional investments such as bonds and stocks, and natural disasters, all of which may adversely affect the US Fund. Foreign investments are subject to risks, which include changes in economic and political conditions, foreign currency fluctuations, changes in foreign regulations, and changes in currency exchange rates that may negatively impact the US Fund’s return. Small- and medium- capitalisation companies may be subject to elevated risks. The US Fund’s assets may be concentrated in a particular sector and may be subject to more risk than investments in a diverse group of sectors.
NYSE Arca Gold Miners Index® (‘GDMNTR’), a trademark of NYSE Group Inc. or its affiliates (‘NYSE’), is licensed for use by VanEck in connection with the US Fund. The US Fund is not sponsored, endorsed, sold or promoted by NYSE and NYSE makes no representation as to the accuracy and/or completeness of GDMNTR or results to be obtained by any person from using GDMNTR in connection with trading the US Fund.


Published: 09 August 2018