Taxes and tightening could brighten gold’s shine
The ramifications of tightening and the proposed tax overhaul could hamper the economy in the long-term adding support to gold.
Contributors: Joe Foster, Portfolio Manager and Strategist, and Imaru Casanova, Deputy Portfolio Manager/Senior Analyst for the Gold Strategy
Small changes for gold price and equities in November as ETP demand increases
The gold price changed very little during the month of November, managing to post a small gain of 0.30% and closing at US$1,274.94 per ounce on 30 November. US economic data releases were mixed during the month with positive indicators offset by some negative surprises. Positive releases included stronger than expected industrial production and capacity utilisation, as well as stronger leading indicators including the Chicago Fed National Activity Index which exceeded expectations by a wide margin and the US Conference Board Consumer Confidence Index (CCI) which soared to a 17-year high. On the negative side, updates included a weaker October jobs report, below consensus Empire Manufacturing Index figures, softer retail sales and disappointing November Purchasing Managers' Index (PMI).4
The US Dollar Index (DXY) was down 1.6% in November and a weaker dollar provided support for gold during most of the month. Gold traded intraday as high as US$1,299 per ounce on 27 November, but failed to break through the US$1,300 resistance level. In November, the gold markets seemed to reflect strong uncertainty around the outcome of the US tax bill. Gold prices fell at month end following strong US 3Q GDP growth revised data that surprised the markets, lifted equities and eroded demand for bullion as a safe haven.
Demand for gold bullion-backed exchange traded products (ETPs) picked up again in November, after a fairly flat October, with holdings up about 0.6% for the month and 11.6% year to date as of 30 November. We track the flows into the gold bullion ETPs since we believe investments in these products typically represent longer-term, strategic investment demand for gold and as such provide an excellent proxy for the direction of the gold market.
With gold lacking strength, gold stocks ended the month slightly down. The NYSE Arca Gold Miners Index (GDMNTR) rose 0.74% during the month.
Rate hike already priced into the market, but ramifications could support gold long-term
Gold has traded range bound in 2017, fluctuating in the US$1,200 to US$1,300 per ounce range for most of the year. So far, the gold price has averaged US$1,257 in 2017, reaching a high of US$1,349 on 8 September. Since then, gold has dropped by more than 5% to trade at approximately US$1,275 as of 4 December. The Federal Reserve rate outlook has been one of the main factors lifting or depressing the gold price. The implied probability of a December hike stayed above 90% during November and is currently near 100%. With the next Federal Open Market Committee (FOMC) rate decision on December 13, we estimate the widely expected next rate increase has been fully or almost fully priced in by the gold markets, but we would not be surprised to see further weakness from here. For reference, the seven trading day period leading to the December 2016 rate hike announcement, saw gold prices drop 2.4%, while prices ended up unchanged during the same period around the December 2015 rate hike. In both cases, weakness ahead of the announcement was followed by strong rallies in the first two months of the following year.
The December rate hike is widely anticipated, and no doubt it is interpreted by the markets as US dollar positive and therefore, gold negative. However, what is likely not anticipated or priced in by the markets is the longer-term impact that further monetary tightening could have on what we believe is a late-cycle economy. Namely, that the tightening policy could end up helping push the US economy into the next recession. In addition, we believe, the burden from increased fiscal deficits resulting from US tax reform would further hamper the economy in the longer term. We expect gold to continue to form a base, trading in the US$1,200 to US$1,350 per ounce range, with a longer-term view that increased financial risk deriving from a potentially weaker or slowing US economy, as well as heightened global geopolitical risk and political struggles in Washington D.C., could drive gold much higher.
Despite high scrutiny, disconnect exists between mining safety and market perception
A recent report by the Mining Journal's The World Risk Report identifies social license, environmental management, project permitting, and mine closure as the most difficult operating risks miners have to manage, ahead of skills availability, cost inflation and geological risk. The findings, which were based on survey responses from resource companies and resource services firms globally, do not surprise those of us covering the industry and familiar with the increasing time, capital, management oversight, and other resources that are dedicated to these areas throughout all stages of a project. It is understandable that mining companies are subject to very high scrutiny given the nature and scale of their operations. But there seems to be a disconnect between what companies are doing to manage the environmental and social impact of their operations and the broader market's perception. In general, it seems miners as a group enjoy a reputation of being irresponsible or negligent in these areas and we think this is unjustified. Of course, accidents happen and no economic operation will ever be 100% protected. A recent tailings dam failure in Brazil, at an operation owned by two mining majors, is an example of the serious impact those accidents can have. But it is unfair, in our opinion, to let these events put all miners in the irresponsible category.
A Closer Look at a Mining Project Timeline and the Extensive Impact Analysis
A look at a mining project's timeline reveals the amount and level of work dedicated to assessing the impact of the project on the environment and surrounding communities, and creating a plan to help minimize any negative impact and manage risks. The scope of the work obviously varies depending on the location of the project and the complexity and scale of the operation. The entire process, including gathering of data, studies, testing, engineering design, community consultations, preparation, submittal, revisions, and final approval of environmental impact studies and other permits required to be awarded an operating license, generally takes several years and can take as long as a decade or more.
Take the Donlin Gold project, for example, owned in part by Barrick Gold. A schematic depicting the estimated development timeline for the project is shown below.
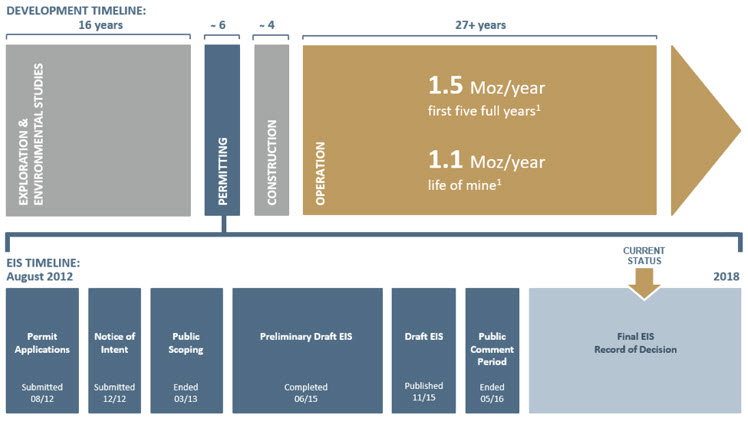
1) Donlin Gold data as per the second updated feasibility study. Projected average annual production represents 100% of which NOVAGOLD's share is 50%. For illustrative purposes only.
The Environmental Impact Statement (EIS) process alone is projected to take six years. In addition, extensive environmental studies were carried out as part of an exploration and studies period that took 16 years to complete. The EIS process will require more than 100 permit applications and involves: an explanation of the purpose and need for the mine and the benefits to local stakeholders; analysis of several design and development options; analysis of the potential physical, biological, social, and cultural impacts and potential measures to help reduce or eliminate such impacts. In addition to this process, the project needs to obtain from other agencies air quality permits, pipeline authorizations, water use and fish habitat permits, waste management, reclamation and closure plan permits, and other approvals.
This comprehensive analysis includes all the work the companies are required to do prior to, during, and after the life of the mine. Companies are usually required to have a detailed plan for rehabilitation of the mine site after closure, including environmental monitoring that extends for long periods of time following closure. In addition, companies usually require provisions (e.g., a reclamation bond) to secure funds towards rehabilitation. And although they are not always required to, many of the companies we invest in work hard to develop skills, programs, and businesses that continue to deliver value for the local communities well beyond the life of the mine.
Companies also set targets and measure and report their environmental, social, health, and safety performance in detail. The level of detail and quality of this type of reporting vary, but most of the gold companies in our research universe have a detailed sustainability report and/or sections of their websites dedicated to it. For comparison, we decided to look up Apple's 2016 Environmental Responsibility report, and were pleased to find that, at 58 pages, it is less than half the size of Newmont's Beyond the Mine 2016 Social and Environmental report.
How well companies manage their social and environmental responsibilities and risks is increasingly more important and critical to their ability to operate and generate shareholder value. Mining companies simply do not have a choice but to spend the time and capital it takes to make sure they can meet their obligations. Hopefully, with time, this will also lead to an improved reputation for the sector.
IMPORTANT DISCLOSURE
Issued by VanEck Investments Limited ABN 22 146 596 116 AFSL 416755 (‘VanEck’). VanEck is a wholly owned subsidiary of Van Eck Associates Corporation based in New York, United States. VanEck Vectors ETF Trust ARBN 604 339 808 (the ‘Trust’) is the issuer of shares in the VanEck Vectors Gold Miners ETF (‘US Fund’). The Trust and the US Fund are regulated by US laws which differ from Australian laws. Trading in the US Fund’s shares on ASX will be settled by CHESS Depositary Interests (‘CDIs’) which are also issued by the Trust. The Trust is organised in the State of Delaware, US. Liability of investors is limited. VanEck Associates serves as the investment adviser to the US Fund. VanEck, on behalf of the Trust, is the authorised intermediary for the offering of CDIs over the US Fund’s shares and issuer in respect of the CDIs and corresponding Fund’s shares traded on ASX.
This is general information only and not financial advice. It does not take into account any person’s individual objectives, financial situation or needs. Investing in international markets has specific risks that are in addition to the typical risks associated with investing in the Australian market. These include currency/foreign exchange fluctuations, ASX trading time differences and changes in foreign regulatory and tax regulations. Before making an investment decision in relation to the US Fund you should read the PDS and with the assistance of a financial adviser consider if it is appropriate for your circumstances. The PDS is available at www.vaneck.com.au or by calling 1300 68 38 37.
Past performance is not a reliable indicator of future performance. No member of the VanEck group of companies or the Trust gives any guarantee or assurance as to the repayment of capital, the payment of income, the performance or any particular rate of return from the US Fund.
An investment in the US Fund may be subject to risks that include, among others, competitive pressures, dependency on the price of gold and silver bullion that may fluctuate substantially over short periods of time, periods of outperformance and underperformance of traditional investments such as bonds and stocks, and natural disasters, all of which may adversely affect the US Fund. Foreign investments are subject to risks, which include changes in economic and political conditions, foreign currency fluctuations, changes in foreign regulations, and changes in currency exchange rates that may negatively impact the US Fund’s return. Small- and medium- capitalisation companies may be subject to elevated risks. The US Fund’s assets may be concentrated in a particular sector and may be subject to more risk than investments in a diverse group of sectors.
NYSE Arca Gold Miners Index is a trademark of ICE Data Indices, LLC or its affiliates (“ICE Data”) and has been licensed for use by VanEck in connection with the US Fund. Neither the Trust nor the Fund is sponsored, endorsed, sold or promoted by ICE Data. ICE Data makes no representations or warranties regarding the Trust or the Fund or the ability of the NYSE Arca Gold Miners Index to track general stock market performance.
ICE DATA MAKES NO EXPRESS OR IMPLIED WARRANTIES, AND HEREBY EXPRESSLY DISCLAIMS ALL WARRANTIES OF MERCHANTABILITY OR FITNESS FOR A PARTICULAR PURPOSE WITH RESPECT TO THE NYSE ARCA GOLD MINERS INDEX OR ANY DATA INCLUDED THEREIN. IN NO EVENT SHALL ICE DATA HAVE ANY LIABILITY FOR ANY SPECIAL, PUNITIVE, INDIRECT, OR CONSEQUENTIAL DAMAGES (INCLUDING LOST PROFITS), EVEN IF NOTIFIED OF THE POSSIBILITY OF SUCH DAMAGES.


Published: 09 August 2018