Gold takes hold amid uncertainty
Gold is now consolidating above the US$1,500 level, and strong price moves through technical levels and risks from Brexit, trade and economic weakness may support gold and gold stocks for a considerable period.

Uncertainties abound as gold reaches fresh highs
Trade tensions have become trade wars, which in turn are threatening to become full-blown currency wars. Gold moved to a fresh six-year high of US$1,555 per ounce on August 26 as markets reacted to retaliatory tariffs between the US and China. It looks as if both countries are battling for economic supremacy. The uncertainty is creating a drag on commerce at a time when it might do the most damage to the global economy. At the same time, central banks worldwide are cutting rates to offset recessionary forces.
As a result, gold has been rising across all currencies as a hedge against economic uncertainty and fiat currency debasement. It hit record local currency highs in Australia, India, Europe (Euro), Japan and many other countries. Gold gained 7.5% over the month and ended at US$1,520.30. Silver also had a stellar performance, rising 13.0% to close at US$18.38. Gold stocks rose in tandem, with the NYSE Arca Gold Miners Index advancing 11.7%, and the MVIS Global Junior Gold Miners Index gaining 8.4%.
Higher gold prices have not deterred central banks from buying the yellow metal. They are currently on pace to exceed last year’s volumes, which were the second strongest on record. Top buyers this year are Russia, Poland, China, Turkey and India. Trade wars and sanctions are giving emerging countries a greater incentive to add more gold to their foreign exchange reserves.
Don’t ignore the warning signs
The gold price is now consolidating above the US$1,500 per ounce level in a similar fashion to the consolidation above US$1,400 in July. Futures positioning and strong bullion ETF inflows suggest the market may be due for a pullback. However, given the strong price moves through technical levels since June, and the economic effects of Brexit uncertainty, the inevitable correction might not happen until gold is trading at substantially higher levels.
US Fed Chairman Powell’s comments from the Jackson Hole conference in July characterised the central bank’s July rate cut as precautionary, a sort of insurance against risks and a mid-cycle adjustment. These comments reminded us of a previous Fed Chairman’s comments ahead of the global financial crisis when we were told that problems in subprime mortgages would stay contained. Market watchers should be concerned by the fact that:
- Since 1921 there have been 11 three-month/10-year treasury yield curve inversions that were followed by 11 recessions. And the 12thsuch inversion began in August.
- With the US ISM Purchasing Managers’ Index falling to 49.1 in August, the world is officially in a manufacturing recession.
- Not since the 1930s has the Fed ended a rate hiking cycle when the funds rate was just 2.5%.
- In a typical easing cycle, the Fed cuts rates by 5% to 6%, suggesting the US will eventually join Europe and Japan in setting rates below zero.
- Since the 2007 credit bubble high, global debt has increased by US$128 trillion to US$244 trillion, while global debt/GDP has jumped from 98% to 187%. Cutting rates has little efficacy in a world that is already drowning in debt.
- Globally, US$17 trillion worth of bonds now trade at negative yields.
We believe many aspects of the financial system are far from normal, and the record economic expansion looks to be on its last legs. These abnormalities may create extraordinary and unpredictable risks. Recent performance indicates that gold and gold stocks may help hedge a portfolio against these risks.
Tracing historical trends of gold and gold stocks
A comparison with previous multi-year periods of rising gold prices might lend some insights as to where the market is heading. The chart below compares several gold bull markets from the past 50 years, classified as either “secular” (long term) or “cyclical” (short term and occurring within an multi-year period of overall declining gold prices or a “bear market”). The gold price performance since 2015 has been tracking the same pattern as the 1993–96 cyclical bull market. However, the price trend since June puts the current market on a trend that is becoming more like the secular bull market from 2001 to 2008 in our view.
Gold performance in historical gold bull markets
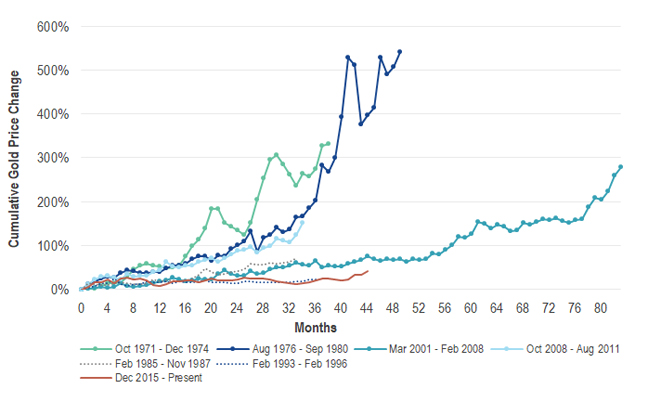
Source: VanEck, Bloomberg. Data as of August 2019. “Gold” represented by Gold Spot ($/oz). Past performance is not indicative of future results.
One of the key drivers of the current gold market is falling real interest rates. With more Fed cuts expected this year, the duration of the current bull market is becoming similar to past secular bull markets. However, it remains to be seen whether the current performance will match the rally in 2001–08, when US dollar weakness drove the market.
This chart plots the spectacular performance of gold stocks during the 2001–08 bull market:
Gold vs. gold stocks during the March 2001 to February 2008 gold bull market
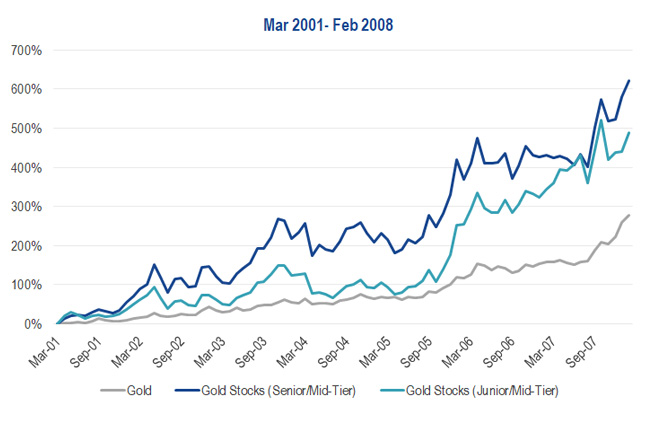
Source: VanEck, Bloomberg. Data as of August 2019. “Gold” represented by Gold Spot ($/oz). “Gold Stocks (Senior/Mid-Tier)” represented by NYSE Arca Gold Miners Index (GDMNTR). “Gold Stocks (Junior/Mid-Tier)” represented by MVIS Global Junior Gold Mining Index (MVGDXJTR). “Senior” miners are defined by production levels of approximately 1.5-6.0 million ounces of gold per year (“Mid-Tier” miners approximately 0.3-1.5 million ounces per year; “Junior” miners approximately <0.3 million ounces per year). Past performance is not indicative of future results. Indices are not securities in which an investment can be made. Index descriptions provided in disclosures below.
How this gold bull market may be different
There are many similarities between the gold industry in 2001 and today. 2001 marked the end of a secular bear market in which gold prices fell to US$253 per ounce and investor sentiment towards the sector was depressed. Likewise, 2019 marks the end of several years of stagnant range-bound trading that was preceded by one of the worse peak-to-trough bear markets on record. Sentiment and valuations are again at extreme lows, in our view.
In both cases, gold miners had endured many years of low gold prices. As a result, they became more efficient, reduced debt and streamlined management. We believe the companies are well managed and profitable. Cost pressure is minimal; therefore, there is no cost inflation to eat away at margins.
A significant difference between the companies today and those in 2001 is a lack of hedging. The mark-to-market of many hedge books turned negative as the gold price rose in the 2000s. This cost companies billions. Today’s gold industry is essentially unhedged, which may give the current miners more leverage to rising gold prices than their earlier counterparts.
Regardless of whether gold equities reach the heights of past cycles, we believe there are now enough risks to financial markets to be supportive of gold and gold stocks for some time.
IMPORTANT DISCLOSURE
Issued by VanEck Investments Limited ABN 22 146 596 116 AFSL 416755 (‘VanEck’). VanEck is a wholly owned subsidiary of Van Eck Associates Corporation based in New York, United States. VanEck Vectors ETF Trust ARBN 604 339 808 (the ‘Trust’) is the issuer of shares in the VanEck Vectors Gold Miners ETF (‘US Fund’). The Trust and the US Fund are regulated by US laws which differ from Australian laws. Trading in the US Fund’s shares on ASX will be settled by CHESS Depositary Interests (‘CDIs’) which are also issued by the Trust. The Trust is organised in the State of Delaware, US. Liability of investors is limited. VanEck Associates serves as the investment adviser to the US Fund. VanEck, on behalf of the Trust, is the authorised intermediary for the offering of CDIs over the US Fund’s shares and issuer in respect of the CDIs and corresponding Fund’s shares traded on ASX.
Nothing in this content is a solicitation to buy or an offer to sell shares of any investment in any jurisdiction including where the offer or solicitation would be unlawful under the securities laws of such jurisdiction. This is general financial product information only and not personal financial advice. It does not take into account any person’s individual objectives, financial situation or needs. Investing in international markets has specific risks that are in addition to the typical risks associated with investing in the Australian market. These include currency/foreign exchange fluctuations, ASX trading time differences and changes in foreign laws and tax regulations. Before making an investment decision in relation to the US Fund you should read the PDS and with the assistance of a financial adviser consider if it is appropriate for your circumstances. The PDS is available at www.vaneck.com.au or by calling 1300 68 38 37.
Past performance is not a reliable indicator of future performance. No member of the VanEck group of companies or the Trust gives any guarantee or assurance as to the repayment of capital, the payment of income, the performance or any particular rate of return from the US Fund.
An investment in the US Fund may be subject to risks that include, among others, competitive pressures, dependency on the price of gold and silver bullion that may fluctuate substantially over short periods of time, periods of outperformance and underperformance of traditional investments such as bonds and stocks, and natural disasters, all of which may adversely affect the US Fund. Foreign investments are subject to risks, which include changes in economic and political conditions, foreign currency fluctuations, changes in foreign regulations, and changes in currency exchange rates that may negatively impact the US Fund’s return. Small- and medium- capitalisation companies may be subject to elevated risks. The US Fund’s assets may be concentrated in a particular sector and may be subject to more risk than investments in a diverse group of sectors.


Published: 09 September 2019