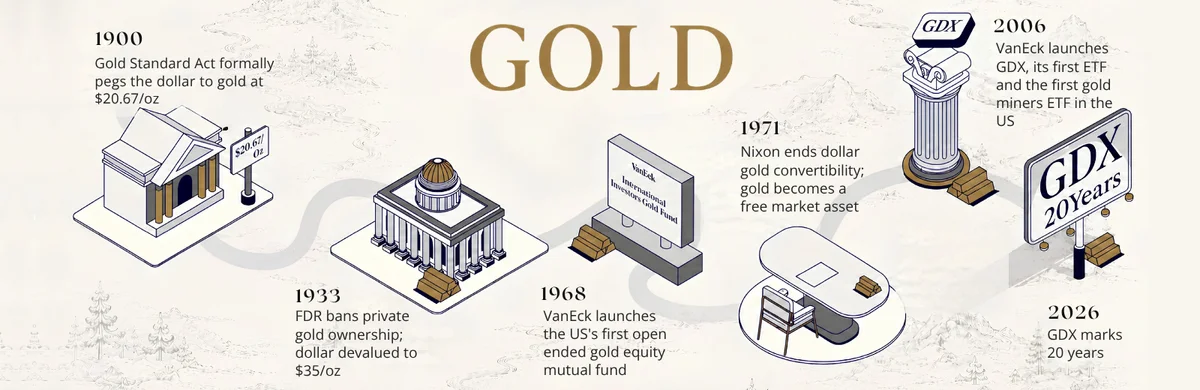
Geopolitical Strife Bolsters Case for Gold
Gold’s safe haven status remains intact
Gold and gold equities’ values as safe haven assets were highlighted in February. The gold price broke out of its 18-month consolidation on February 11, when the US warned of a possible Russian attack on Ukraine. Gold then rallied to around US$1,900 per ounce, following news of shelling in eastern Ukraine and warnings of an imminent invasion. When bombs started to fall on February 24, safe haven assets like gold, the US dollar, and US Treasuries all had strong advances. Gold spiked to a high of US$1,974/oz in Asian trading, while risk assets such as equities and bitcoin suffered sharp declines. The gold price reversed from the highs, pulling back in European trading and ending down on the day after US President Joe Biden announced sanctions on Russia that were not as severe as expected. Risk assets also witnessed a quick reversal, ending the day with gains. Gold ended the month with a US$111.82 (6.2%) gain at US$1,908.99. Gold stocks carried good leverage to gold’s move higher, as the NYSE Arca Gold Miners Index advanced a 10.9%.
Sentiment improving, and not just on geopolitics
Historically, geopolitical turmoil has been a short-term driver for the price of gold. Geopolitical drivers rarely last in the longer term for gold, as the world usually adjusts to new realities. However, the Ukraine war is having a greater impact on the global economy and financial system, compared to any regional conflict in recent memory. Gold is now consolidating its break-out gains above the US$1,900 level.
After 18 months of lacklustre trading, and apart from the Russia/Ukraine conflict, sentiment is improving for gold for several reasons:
- Technically, gold has seen a half-dozen breakout attempts that have failed since it reached its US$2,075 high in 2020. Finally, there is now a confirmed break-out and a more positive chart trend in view.
- Investors were questioning gold’s efficacy as it struggled amid rising inflation. The recent price moves leave no doubt that gold is performing as a safe haven asset. We believe its role as an inflation hedge will also emerge if inflation persists in 2022.
- For just over a month, gold bullion exchange traded products have seen their strongest inflows since gold peaked in August of 2020. This indicates a return of strong investment demand.
Rate hikes: too little too late?
The US Federal Reserve (“Fed”) is about to begin a rate-hiking cycle in an effort to bring down inflation that grew in January, at an annual rate of 7.5% for the US Consumer Price Index (CPI) and 9.7% for the Producer Price Index (PPI). The Fed is now behind the curve because it spent all of 2021 trying to convince the markets that inflation was 'transitory', instead of taking measures to insure that inflation did not stray too far from its 2% target. At this point, there are substantial risks that neither economic growth nor inflation will trend very far in the directions the Fed would like. The economy is decelerating from the US$3.6 trillion in federal pandemic spending. Estimates in President Biden’s 2022 budget proposal show that gross domestic product (GDP) growth projections would slow from over 5% in 2021 to less than 2% in 2024 and beyond. A Wall Street Journal article publidhed on February 22 highlights comments from Goldman Sachs’ chief economist, who estimated that the COVID-19 relief packages had boosted GDP by 6% in 2020-2021. Goldman estimates fiscal support will continue to boost GDP by around 2% in 2022. By 2023, without further government support, the economy will have to stand on its own, presumably with the added burden of much higher interest rates. In addition, the radical changes taking place in the geopolitical landscape could create new impediments to growth.
Inflation looks entrenched
There is debate as to whether inflation will persist in the long term. The chart shows how, historically, interest rates roughly follow the trend of the CPI. However, the last data points on the chart show that recent yields have not moved in tandem with inflation. Such a relationship has not lasted historically. The chart suggests that the treasury market continues to believe inflation will come down. On the other hand, Treasury rates may rise to match inflation with a lag. If the Fed is compelled to end its rate hiking program prematurely to save the economy, inflation could remain elevated. In addition, unlike past demand driven inflation cycles, the current cycle is driven largely by supply chain issues. Tight policies bring down inflation by broadly curtailing demand. However, the Fed has no tools to address supply problems, nor can it counter commodity and other price pressures brought on by the war.
Interest rates and inflation trends
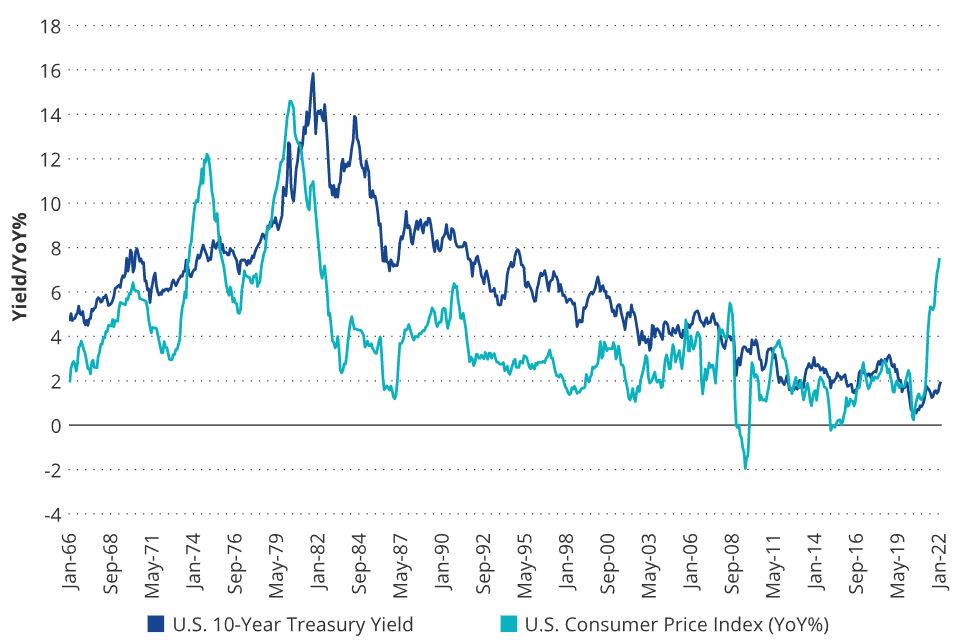
Source: Federal Reserve Bank of St. Louis. Data as of January 2022. Past performance is not indicative of future results.
All of this suggests that current environment will prove extraordinarily difficult to manage.
Published: 09 March 2022