Gold gains further momentum
Structural shift in positioning
The gold market rallied in December, gaining US$53.29 (3.6%) to end at US$1,517.27 per ounce. A weaker US dollar supported the gold market. Gold was also buoyed by strong advances in metals prices, especially copper and palladium, as the US and China announced details of the first stage of a trade deal.
Gold wasn’t deterred by the booming stock market, which continued to post all-time highs. It has become obvious to us that stocks are being pumped up by liquidity supplied by the US Federal Reserve (Fed) and corporate buybacks. Gold rose in tandem with the stock market because a market that trades on liquidity, rather than fundamentals, is vulnerable to shocks, a drop in liquidity or other risks.
Holiday deals abound
Gold stocks also did well in December, with industry mergers and acquisitions dominating the news. Of the seven M&A deals announced, four were asset sales - mid-tier companies buying non-core mining properties from super-majors Barrick and Newmont. The other three were M&As, each with a different deal structure (as seen below). To gauge the market reaction to these three deals, we looked at the two-week performance after the deal announcement for each company relative to the NYSE Arca Gold Miners Index:
|
Transaction |
Parties |
Role |
Deal Structure |
Premium |
Stock Performance |
|
Acquisition |
Kirkland |
Acquirer |
All-Stock |
24% |
-24.8% |
|
Detour |
Acquiree |
-1.0% |
|||
|
Acquisition |
Zijin |
Acquirer |
All-Cash |
29% |
+11.1% |
|
Continental |
Acquiree |
+12.3% |
|||
|
Merger-of-Equals |
Leagold |
n/a |
All-Stock |
n/a |
+14.8% |
|
Equinox |
n/a |
+18.2% |
Source: VanEck. Data as of December 2019.
The market clearly favoured the all-cash and merger-of-equals (MOE) deals over the all-stock premium deal. We believe there are three reasons for this: 1) cash and MOE deals are structures that limit speculation from arbitrageurs, 2) premium stock deals have a legacy of destroying value for shareholders, and 3) investors frown on large, potentially dilutive quantities of stock being issued.
In the longer term, we believe that all of these deals will create value. However, we can’t over-emphasise the importance of properly structuring a deal so that the combined entity moves forward with positive performance and enthusiastic support from shareholders.
Reasons for continued optimism in 2020
Gold and gold stocks had outstanding performances in 2019. The gold price surged about 18% to US$235 per ounce. The leverage of gold stocks to the price of gold was on full display, as the NYSE Arca Gold Miners Index gained more than 40%. Encouragingly, we believe that there are several reasons for continued optimism for gold and gold stocks in 2020.
The interest rate environment has become very supportive of gold prices. Real rates on one-year Treasuries turned negative in 2019. The Fed cut rates three times in 2019 and, while on hold at the moment, may continue the rate cutting cycle later in 2020.
The chart below shows that gold performs well as real rates fall below 2%, with improving performance as real rates become more negative. This is because gold is often seen as a better store of value than bonds when real rates are negative. In addition, deeply negative real rates are usually accompanied by stressful levels of inflation or deflation that drive investors to gold as a safe haven .
Gold can really shine with sub-2% (or negative) real rates
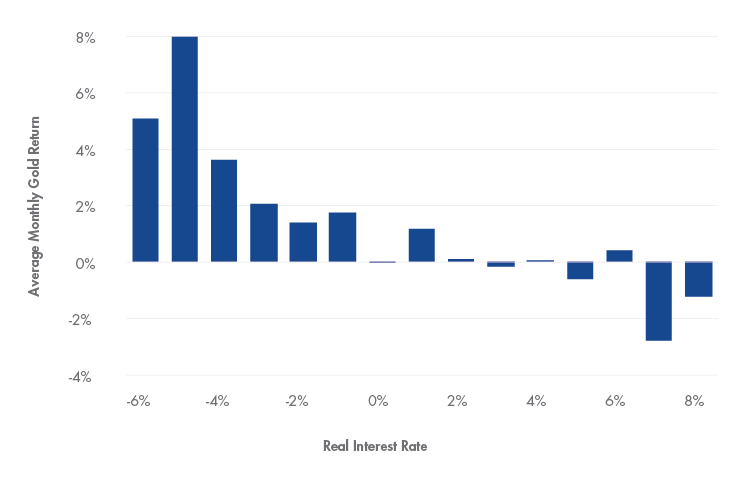
Source: RBC. Data as of September 2019. Real Interest Rate calculated as the monthly yield of US Federal Reserve one-year treasury note with constant maturity adjusted for inflation.
The dollar strengthened from 2014 to 2016, and again in 2018 owing to robust US economic growth, which was priced into the dollar. As a result, with its best performance behind it, the dollar index drifted sideways in 2019, while gold rose against most currencies. With US GDP growth forecast to remain steady and the uncertainty of the 2020 US presidential election, we doubt that the dollar would be a headwind for gold.
And, if all else fails…
Looking further ahead, long-term debt cycles, the economy, stock markets and the social/political realm may culminate in financial difficulties that have yet been seen since the Global Financial Crisis. Tensions in the Middle East are already escalating following the recent US airstrike in Iraq. The burgeoning growth in sovereign debt is unsustainable, while corporate debt levels are worrying. Likewise, negative-yielding debt in Europe and Japan makes little financial sense.
Ludwig von Mises said there are only two ways to end a credit-fueled boom: “The first is to withdraw the credit. The second is the utter debasement of the currency.” Also known as a debt jubilee, helicopter money, monetisation or Modern Monetary Theory, von Mises’ second option has been chosen throughout civilisation. The Romans and Weimar Germany are prominent historic examples, while Zimbabwe and Venezuela are modern examples.
In the middle of a future crisis, debt monetisation might again become the solution of choice in the US and other major economies. The Dutch National Bank website suggests a post monetary debasement financial structure: “If the system collapses, the gold stock can serve as a basis to build it up again. Gold bolsters confidence in the stability of the central bank’s balance sheet and creates a sense of security.”
IMPORTANT DISCLOSURE
Issued by VanEck Investments Limited ABN 22 146 596 116 AFSL 416755 (‘VanEck’). This is general information only about financial products and not personal financial advice. It does not take into account any person’s individual objectives, financial situation or needs. Before making an investment decision, you should read the relevant PDS and with the assistance of a financial adviser consider if it is appropriate for your circumstances. PDSs are available at www.vaneck.com.au or by calling 1300 68 38 37.
No member of VanEck group of companies gives any guarantee or assurance as to the repayment of capital, the payment of income, the performance, or any particular rate of return of any VanEck funds. Past performance is not a reliable indicator of future performance.
VanEck is the responsible entity and issuer of units in the VanEck Vectors ETFs traded on ASX. All investments carry some level of risk. Investing in international markets has specific risks that are in addition to the typical risks associated with investing in the Australian market. These include currency/foreign exchange fluctuations, ASX trading time differences and changes in foreign regulatory and tax regulations.
NYSE Arca Gold Miners Index is a trademark of ICE Data Indices, LLC or its affiliates (“ICE Data”) and has been licensed for use by VanEck in connection with the US Fund. Neither the Trust nor the Fund is sponsored, endorsed, sold or promoted by ICE Data. ICE Data makes no representations or warranties regarding the Trust or the Fund or the ability of the NYSE Arca Gold Miners Index to track general stock market performance.
ICE DATA MAKES NO EXPRESS OR IMPLIED WARRANTIES, AND HEREBY EXPRESSLY DISCLAIMS ALL WARRANTIES OF MERCHANTABILITY OR FITNESS FOR A PARTICULAR PURPOSE WITH RESPECT TO THE NYSE ARCA GOLD MINERS INDEX OR ANY DATA INCLUDED THEREIN. IN NO EVENT SHALL ICE DATA HAVE ANY LIABILITY FOR ANY SPECIAL, PUNITIVE, INDIRECT, OR CONSEQUENTIAL DAMAGES (INCLUDING LOST PROFITS), EVEN IF NOTIFIED OF THE POSSIBILITY OF SUCH DAMAGES.
Please note that the information herein represents the opinion of the author, but not necessarily those of VanEck, and this opinion may change at any time and from time to time. Non-VanEck proprietary information contained herein has been obtained from sources believed to be reliable, but not guaranteed. Not intended to be a forecast of future events, a guarantee of future results or investment advice. Historical performance is not indicative of future results. Current data may differ from data quoted. Any graphs shown herein are for illustrative purposes only. No part of this material may be reproduced in any form, or referred to in any other publication, without express written permission of VanEck.
©2019 VanEck


Published: 09 January 2020