Gold rallies on geopolitical uncertainty
Catch up on recent movements in the gold market, as we unravel the factors steering the performance of gold and its miners.
Gold rallies on geopolitical uncertainty
Gold had a strong October. Following tragic developments in the Middle East earlier in the month, gold demonstrated its historically proven role as a safe haven investment, a hedge against market uncertainty, volatility and geopolitical risk, and as an asset offering protection when there is a heightened level of peril and fear. Gold traded at a monthly low of US$1,820 per ounce on October 5, before rallying above US$1,900 a week later and, finally, above US$2,000 on October 27. The price of gold settled at US$1,983.88 by the end of October, posting a 7.32% gain (up US$135.26 per ounce) for the month.
Gold stocks kept pace with gold in the first part of the rally. However, just as gold was approaching US$2,000, gold stocks lost steam and gave back half of their earlier gains. The NYSE Arca Gold Miners Index was up 6.18% during the month. The underperformance of gold stocks further widens the valuation gap between gold stocks and gold.
Why do we even own gold stocks?
Historically, gold stocks have a strong correlation to the price of gold. Despite experiencing a significant de-rating after the last gold bull market, gold mining stocks have outperformed gold during the current gold bull market, which began around the end of 2015.
Gold stocks vs. gold: Annualised total return since start of current gold bull market (Dec 2015)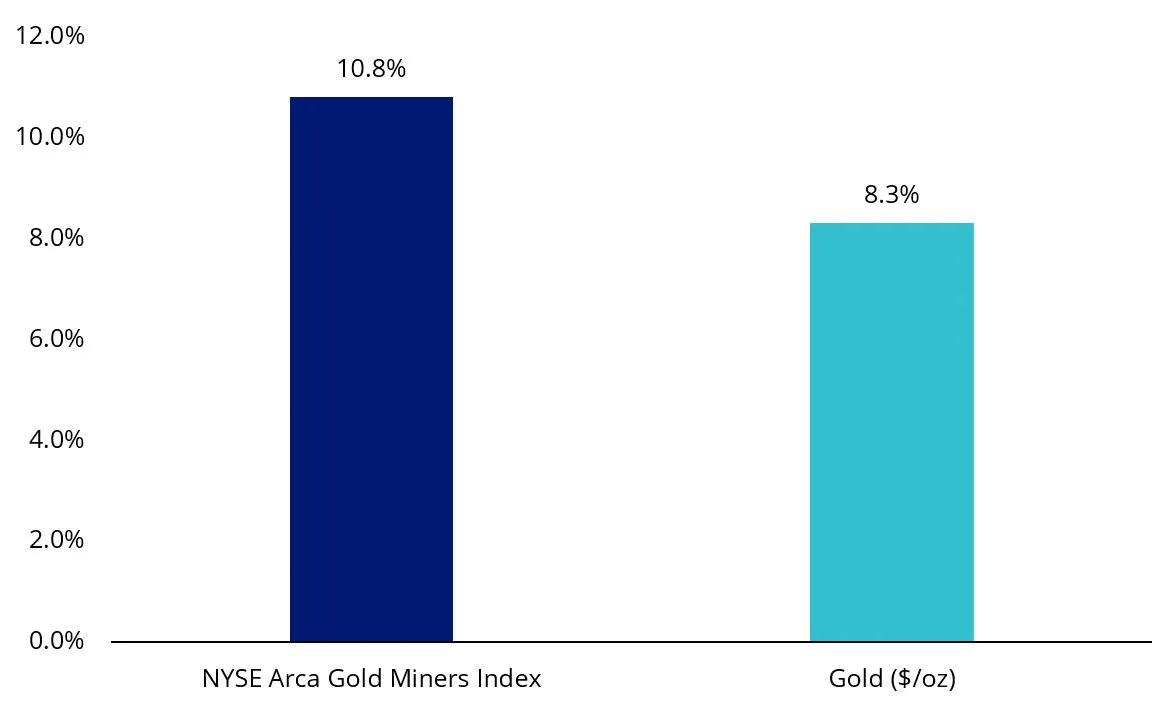
Source: Bloomberg. Data as of October 2023.
Gold stocks are supposed to outperform the metal when gold’s price is rising. Their leverage to gold justifies outperformance. For any given move in the price of gold, operating cash flow generated by these companies increases (or decreases) by a much greater percentage.
Using gold mining company Alamos as a case study, the company estimates that a 5% increase in the price of gold (about a +US$100/oz move), would translate into an increase of almost 30% in their free cash flow in 2024.
Alamos consolidated free cash flow outlook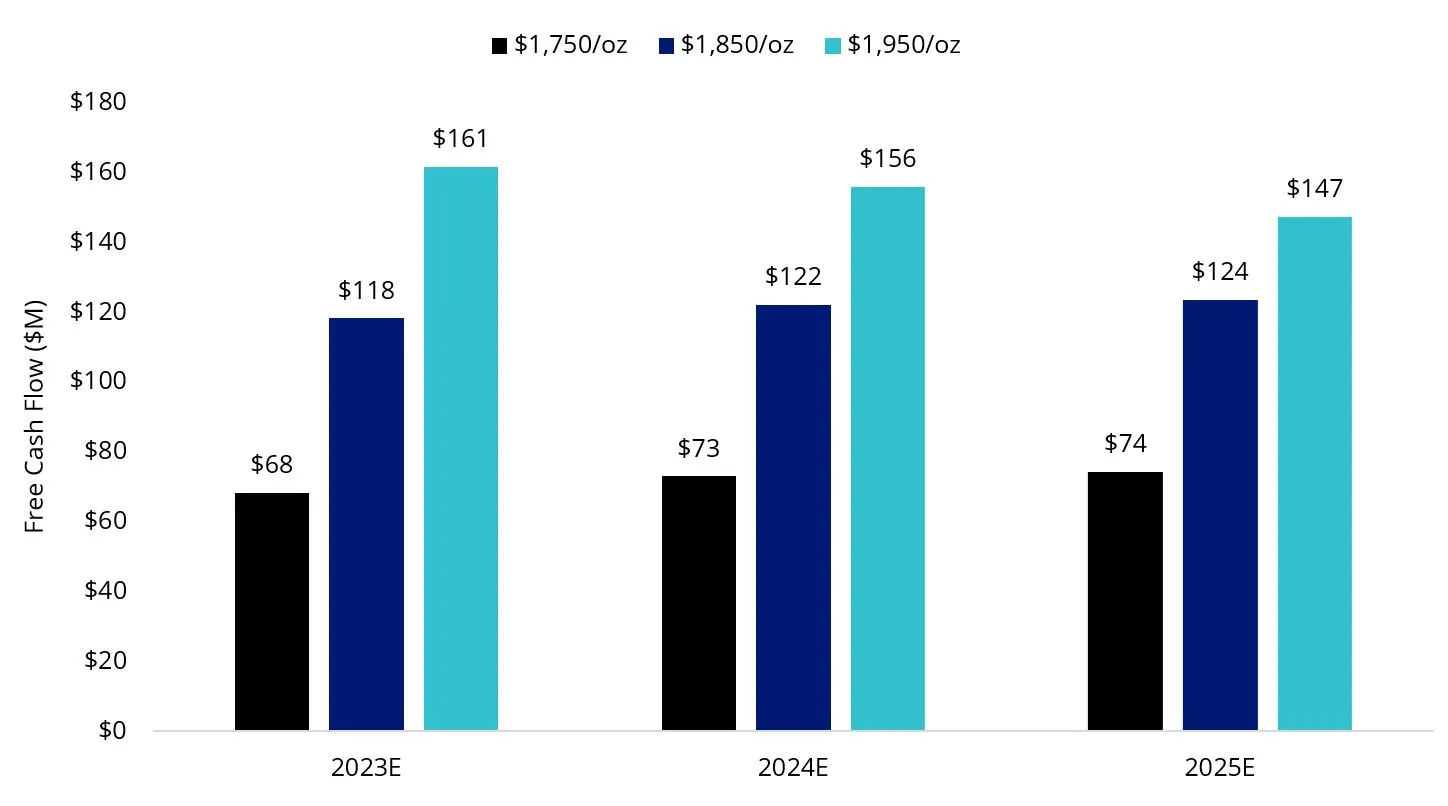
Source: Alamos Gold. Data as of May 2023.
Thus, despite the risks associated with mining operations, investors choose to add gold stocks to their portfolios due to the potential for amplified returns during a sustained gold rally.
We are surprised and disappointed to see gold stocks underperform gold this year. To be clear, gold stocks also underperformed gold last year. However, in 2022, gold was down slightly during the year (-0.28%) and rampant cost inflation not only ate away at profit margins but also caught the sector by surprise, causing most companies to miss cost guidance issued earlier in the year. The market penalised gold stocks, both for shrinking margins and for failing to meet expectations. The NYSE Arca Gold Miners Index, for example, was down 2.04% in 2022.
In contrast, gold is up almost 9% this year and, so far, companies’ 2023 results do not point to guidance revisions as punitive as last year.
Potential causes for the growing gap between gold stocks and gold
Here are a few factors we think could be at play:
- Central bank demand—One of the main drivers of gold prices this year has been strong central bank net purchases, which is potentially set to beat record levels reported for 2022.
Central bank net purchases of gold
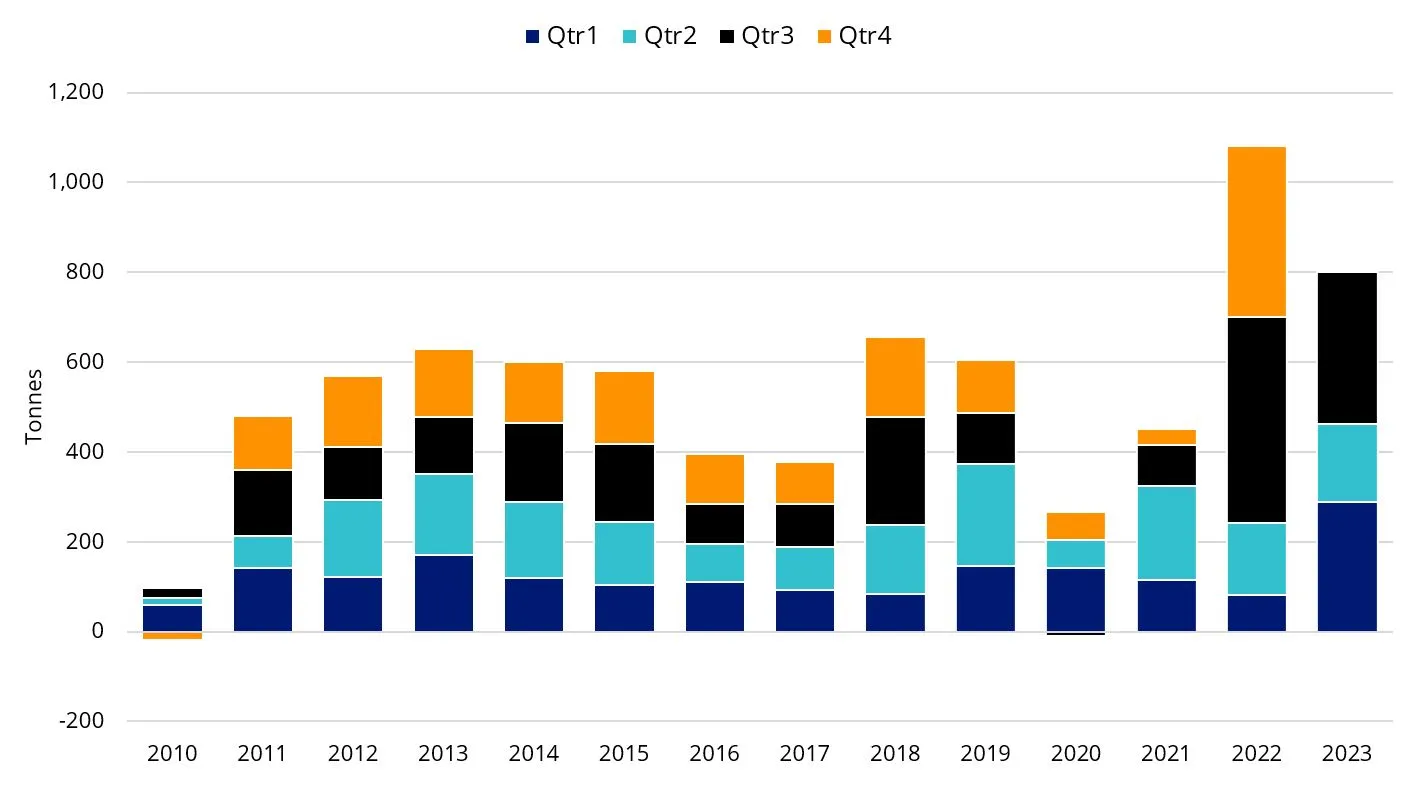
Source: World Gold Council. Data as of September 2023.
In contrast, investment demand, which is usually the main driver behind a gold price rally, has declined this year (down 7% year-to-date), as measured by ETF holdings of gold bullion. Without another center of demand for gold stocks to offset the lack of investment demand, poor market sentiment and apathy towards gold has impacted the gold stocks to a greater extent.
- Industry operating cost inflation—While industry cost inflation has subsided, operating costs guided for 2023 are still higher than in 2022. Analysts’ estimates for the sector’s average all-in sustaining costs in 2023 vary from about 5-8% higher relative to 2022. While the gold price has helped sustain margins relative to last year, the market seems to be dissatisfied with the lack of significant margin expansion. These concerns were exacerbated in October, following negative 2023 guidance revisions by Newmont, the largest gold mining company in the world.
- General equity market exposure—The broader equity markets were down during the month. The S&P 500 and the NASDAQ were down 2.10% and 2.8%, respectively, in October, with weak performance in the later part of the month when the gold equities also fell. There have been past episodes where gold stocks sold off during the early stages of a broader market sell-off.
- Country-specific risks—Two country specific news items at the end of October may have also impacted perception of sector risk and deepened negative sentiment towards gold mining stocks. The Panamanian government announced a newly enacted law that put at-risk a revised and approved contract for the Cobre Panama copper mine operated by First Quantum Minerals. Separately, Bloomberg reported, on October 27, that Burkina Faso had revised its mining code, increasing the top end of its sliding scale royalty scheme from 5% for gold prices above US$1,300/oz, to 7% for gold prices above US$2,000/oz.
Concerns may be overblown
While these concerns are valid—especially as they relate to operating costs—at present, we see gold companies as undervalued. Historically, the sector has never traded at lower valuation multiples. The companies’ continued focus on cost control, portfolio optimisation and disciplined capital allocation to drive growth and maximise returns, along with our outlook for higher gold prices, support our expectations for a re-rating of the sector. Gold stocks have outperformed in the first few days of November; perhaps the re-rating has already begun.
Gold stocks: Premium/discount to gold price
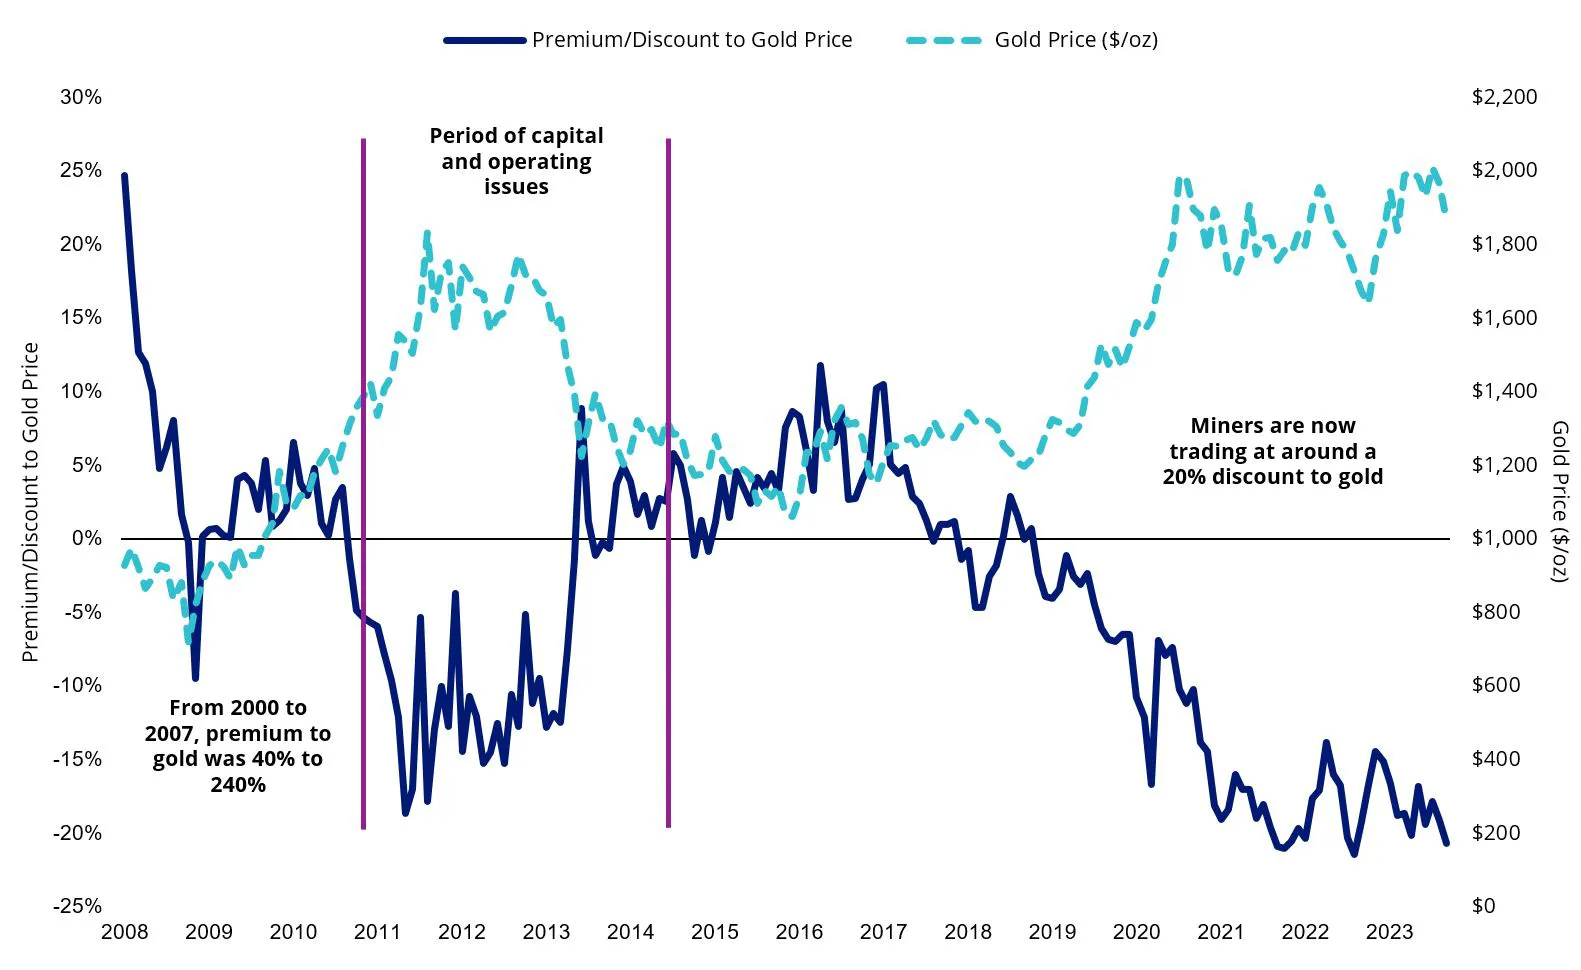
Source: Scotiabank. Data as of September 2023.


Published: 11 November 2023
Any views expressed are opinions of the author at the time of writing and is not a recommendation to act.
VanEck Investments Limited (ACN 146 596 116 AFSL 416755) (VanEck) is the issuer and responsible entity of all VanEck exchange traded funds (Funds) listed on the ASX. This is general advice only and does not take into account any person’s financial objectives, situation or needs. The product disclosure statement (PDS) and the target market determination (TMD) for all Funds are available at vaneck.com.au. You should consider whether or not an investment in any Fund is appropriate for you. Investments in a Fund involve risks associated with financial markets. These risks vary depending on a Fund’s investment objective. Refer to the applicable PDS and TMD for more details on risks. Investment returns and capital are not guaranteed.