Gold shines through market chaos
Coronavirus concern was the dominant driver across markets in February, and gold was no exception. However, historically, gold stocks have experienced a quick rebound in a panic.
Gold shines through market chaos

Concerns over COVID-19’s widening spread dominated global financial markets in February. The gold market was no exception. Gold fell to its monthly low on 5 February, while the S&P 500 rose to new all-time highs on the belief that the impact from the outbreak would be contained. As the number of infections increased, the global economic outlook became murkier. Gold rallied to a seven-year high of US$1,689 per ounce on 24 February as worries over the potential impact on global growth sparked safe-haven buying. Meanwhile, gold bullion exchange traded funds saw an unprecedented 25 consecutive days of inflows.
But markets came unglued towards the month-end, as the virus spread further afield in Italy, Iran and the US. Most stock markets slumped, creating a flight to cash, margin calls, and unusual derivatives trading. Safe haven assets such as gold, gold stocks and the US dollar also fell. Despite the wild market swings, gold held up better than some equity markets, declining US$3.47 per ounce (0.2%) over the month.
Outlook
While the sell-off in gold stocks was painful, it is not unusual in the middle of a stock market panic. The last such example was during the 2008 financial crisis. Following Lehman’s bankruptcy in September that year, gold declined just 10% before trending higher about a month later. Over the same period in 2008, the NYSE Arca Gold miners Index fell 48%, but by December 16 it had recovered to its pre-Lehman level in a classic V-shaped recovery. Contrast this with the S&P 500 that didn’t reach a bottom until 6 March 2009 after falling 46%. The S&P 500 didn’t recover its post-Lehman losses until January 2011. So, while the general stock market was struggling to recover for over two years, the gold stock market quickly rebounded and went on to bull market gains.
We believe the markets will look back on COVID-19 “black swan” as a buying opportunity for gold shares. However, whether the worst is behind us is anyone’s guess. As the virus spreads and the prospects for an immediate vaccine or treatment seem uncertain, the economic impact will be substantial; we would not be surprised to see the longest economic expansion and bull market in history come to an end in 2020. The slump in leading manufacturing indicators worldwide provides an early indication of the extent of economic weakness.
Any action the US Federal Reserve (Fed) takes in response to a virus-weakened economy is likely to lack efficacy. There are two aspects that make a coronavirus economy extremely difficult to stimulate. First, this is a deflationary shock with declines or stoppages in work, travel, leisure and other forms of economic activity.
Second, it is likely to create shortages due to the interruption of global supply chains, which would normally be inflationary. No amount of rate cuts or quantitative easing will have much impact until people and businesses are able to resume normal activities. In any case, central banks have little or no room to stimulate further, with the Fed funds rate already low at 1.0% - 1.25%, and comparable rates in much of Europe and Japan are negative.
The Fed has typically cut rates by roughly 5% in past recessions. If there is a recession, we believe that debt will become the foremost risk, as it has been in nearly every recession. Corporate profit growth has been in decline and Goldman Sachs now projects no earnings growth this year. Yet corporate debt is at record levels, as are the amount of risky leveraged loans.
In addition, more debt is likely to be downgraded to junk status in a recession, which could force many funds to sell. Meanwhile, overwhelming levels of sovereign debt may limit government’s ability to borrow and spend in a downturn. Central banks may come under pressure to monetise or print money to keep governments and businesses afloat. These are the financial risks that might drive gold higher in the next recession.
As markets gyrate, gold investors must not lose sight of the bigger picture. For over a year, falling real rates have primarily driven the gold price. With many markets in disarray amid the widening outbreak, gold has not responded to the fall in real rates. Once the volatility subsides, we expect real rates to continue driving gold prices.
Gold and gold stocks are in the middle of a secular bull market that started in December 2015 when gold bottomed out at US$1,050 per ounce. The two gold price charts highlight the technical similarities between the current bull run and the 2001 – 2011 rally. The top chart tracks the price trend of the current bull market. It began with a weakly rising trend for several years, then accelerated to a stronger trend in 2019. Likewise, in the bottom chart an early trend of weakly rising prices broke into a stronger trend in 2005. In the earlier market (bottom chart), the ultimate trend followed the financial crisis in 2008. The red circle shows roughly where the current market might be in the larger scheme of things, using the 2001 – 2011 market as an analogy.
Fundamentally, each of these markets had different drivers, with the early 2000s market driven by the fallout from the tech bust and US dollar weakness. The early years of the current market were driven by geopolitical risks and Fed activity. Regardless of specific drivers, both markets rose with increasing risks to the global financial system where gold was bought as a safe store of wealth.
Comparing bulls: Current market similar to gold’s last secular rally
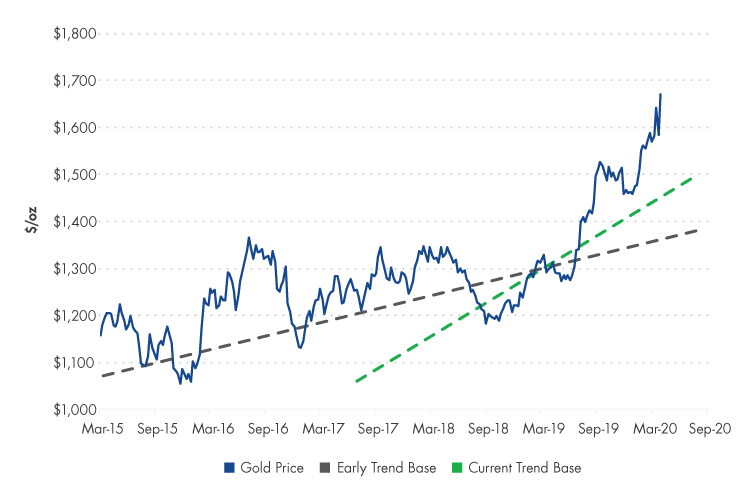
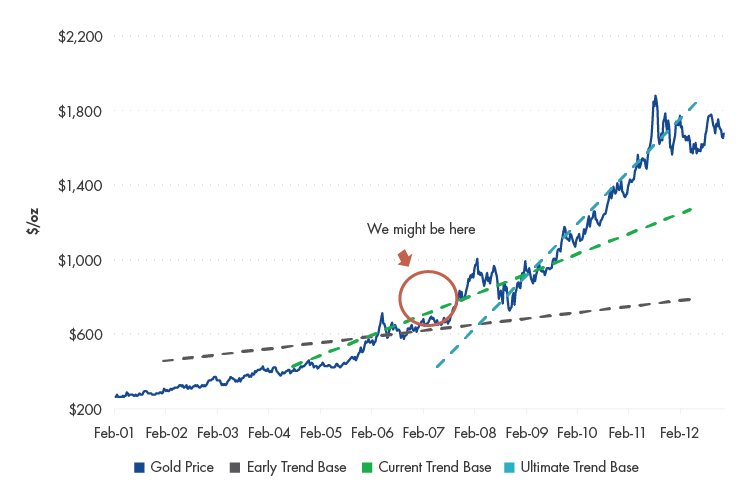
Source: Bloomberg, VanEck. Data as of 28 February, 2020. Past performance is not a reliable indicator of future performance. Chart is for illustrative purposes only.
IMPORTANT DISCLOSURE
Issued by VanEck Investments Limited ABN 22 146 596 116 AFSL 416755 (‘VanEck’). This is general information only about financial products and not personal financial advice. It does not take into account any person’s individual objectives, financial situation or needs. Before making an investment decision, you should read the relevant PDS and with the assistance of a financial adviser consider if it is appropriate for your circumstances. PDSs are available at www.vaneck.com.au or by calling 1300 68 38 37.
No member of VanEck group of companies gives any guarantee or assurance as to the repayment of capital, the payment of income, the performance, or any particular rate of return of any VanEck funds. Past performance is not a reliable indicator of future performance.
VanEck is the responsible entity and issuer of units in the VanEck Vectors ETFs traded on ASX. All investments carry some level of risk. Investing in international markets has specific risks that are in addition to the typical risks associated with investing in the Australian market. These include currency/foreign exchange fluctuations, ASX trading time differences and changes in foreign regulatory and tax regulations.
NYSE Arca Gold Miners Index is a trademark of ICE Data Indices, LLC or its affiliates (“ICE Data”) and has been licensed for use by VanEck in connection with the US Fund. Neither the Trust nor the Fund is sponsored, endorsed, sold or promoted by ICE Data. ICE Data makes no representations or warranties regarding the Trust or the Fund or the ability of the NYSE Arca Gold Miners Index to track general stock market performance.
ICE DATA MAKES NO EXPRESS OR IMPLIED WARRANTIES, AND HEREBY EXPRESSLY DISCLAIMS ALL WARRANTIES OF MERCHANTABILITY OR FITNESS FOR A PARTICULAR PURPOSE WITH RESPECT TO THE NYSE ARCA GOLD MINERS INDEX OR ANY DATA INCLUDED THEREIN. IN NO EVENT SHALL ICE DATA HAVE ANY LIABILITY FOR ANY SPECIAL, PUNITIVE, INDIRECT, OR CONSEQUENTIAL DAMAGES (INCLUDING LOST PROFITS), EVEN IF NOTIFIED OF THE POSSIBILITY OF SUCH DAMAGES.
Please note that the information herein represents the opinion of the author, but not necessarily those of VanEck, and this opinion may change at any time and from time to time. Non-VanEck proprietary information contained herein has been obtained from sources believed to be reliable, but not guaranteed. Not intended to be a forecast of future events, a guarantee of future results or investment advice. Historical performance is not indicative of future results. Current data may differ from data quoted. Any graphs shown herein are for illustrative purposes only. No part of this material may be reproduced in any form, or referred to in any other publication, without express written permission of VanEck.
©2020 VanEck


Published: 06 March 2020