Focus on gold miners' cash flow, not earnings
Gold steadies on mixed economic outlook
Economic data releases in July fuelled expectations that the US Federal Reserve (Fed) is nearing the end of its hiking cycle. This supported gold prices which were up 2.4% during the month, and placed pressure on the US dollar which went down 1.03%, as measured by the US Dollar Index (DXY). Gold climbed back above US$1,950 per ounce on July 12, following the release of June’s US Consumer Price Index figures showing a 3% year-on-year increase, compared to 4% in May. Gold advanced further, reaching a monthly high of US$1,978.72 on July 18, as US retail sales for June came in below expectations. The yellow metal held on to most of its gains as the markets digested another interest rate hike by the Fed on July 26, and a 3% yearly increase in the June’s US Personal Consumption Expenditures Price Index, which is the Fed’s preferred inflation gauge. Gold closed at US$1,965.09 on July 31.
NYSE Arca Gold Miners Index (GDMNTR) outperformed gold, rising 3.22% during the month. The Q2 2023 financial and operating results for the gold sector have been mixed. Many of the producers had flagged a weaker first half of the year, and most of them have maintained their full year 2023 guidance. Thus, we expect an improvement in the second half of 2023. The market is focused on companies meeting expectations, so any significant misses are likely to lead to poor share price performance.
Why forecasting earnings for gold miners is hard
While we agree that companies must meet their guided targets to gain market confidence in their ability to deliver consistent results, we also understand the unique challenges of the mining industry. As long-term investors looking for value creation, we are less obsessed with quarterly earnings and more focused on companies’ outlook for free cash flow generation over the next 10 to 20 years. From decades of experience covering this sector, in our view, it is difficult to forecast a precious metals company’s earnings for any given quarter. The challenges include:
- The fact that these companies are issuing forecasts based on only estimates of the properties of the gold deposits they are mining. We expect that these estimates are a good representation of the gold deposit over the life of the mine. Quarter-over-quarter, it is also reasonable to expect variations from those estimates that could impact earnings, while having no material impact in the net asset value of the mine or the company.
- Companies issue full-year guidance which tries to account for quarter-to-quarter fluctuations, but analysts must issue quarterly guidance that cannot predict these variations. It is these quarterly estimates that the markets gauge companies against.
- Earnings are based on complex accounting and reporting standards, including one-off and non-cash items, that make it difficult to reconcile reported earnings to estimates.
- Other factors, including the variations in the realised price of gold and other produced metals. While analysts may be able to account for spot price fluctuations during the quarter, predicting the timing of sales and the impact of provisionally priced sales (which later need to be adjusted) is challenging.
Focusing on the longer-term
In our view, focusing on free cash flow generation not just over the current quarter but over the long term, is a better way to assess the value and investment appeal of a gold mining company. Our internal models generate an in-house metric which we have created to capture our approach. We refer to it as “free cash flow per ounce”, and it is the total, undiscounted free cash flow the company generates over its operating horizon, divided by all the gold (or gold equivalent) ounces we estimate it will mine during that period. It is a simple, yet transparent measure that allows us to assess the relative valuations of the companies in our universe.
Enterprise value/oz vs. Free-cash-flow/oz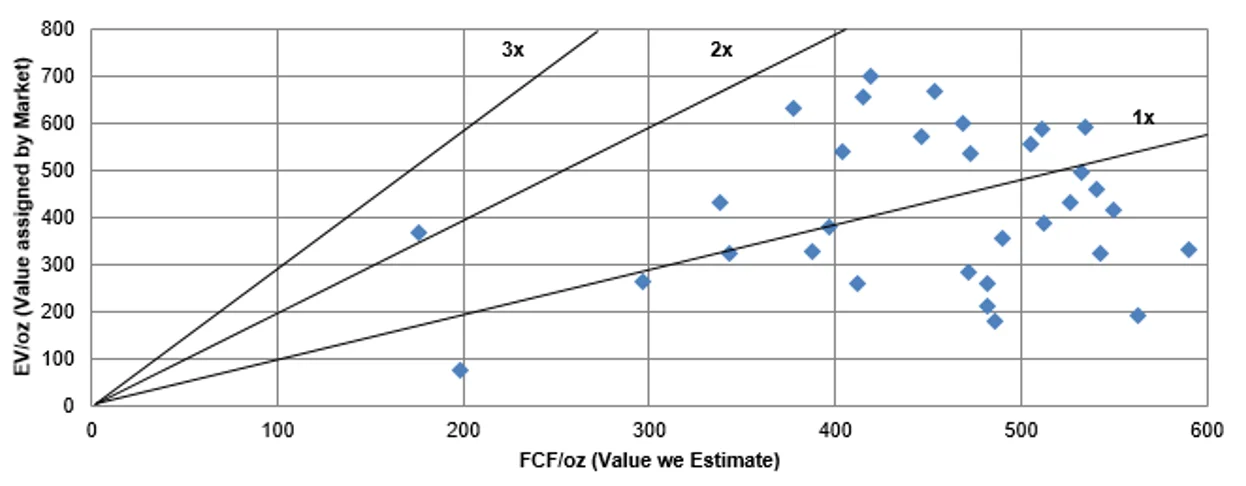
Source: VanEck. For illustrative purposes only. Enterprise value (EV) per ounce (EV/oz) is the ratio of a company's enterprise value vs the total amount of mineral resources in the ground. FCF = Free-Cash-Flow.
During earnings season, earnings-per-share headlines move stock prices. We track and assess a company’s record of delivering against expectations/guidance. We do make changes to our portfolio based on this track record and its potential impact on future share price performance. However, we do not rush to buy or sell a stock because it beat or missed earnings until we assess the impact of these results in our free cash flow forecast of the company over the long term. We believe gold equity investors should demand that companies deliver against their operational targets, while focusing less on quarterly earnings and more on the outlook for free cash flow over the next decade or two.


Published: 17 August 2023