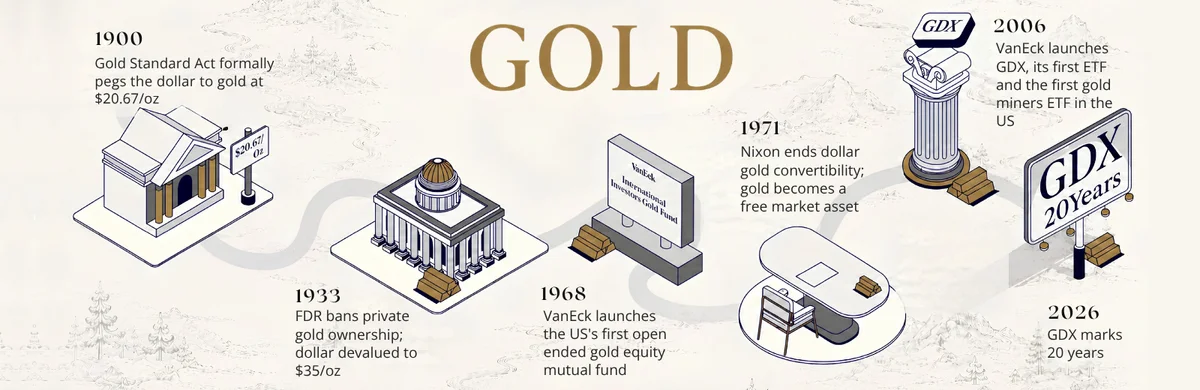
The 2024 gold miners’ rush
Since October lows of US$1,819.45 per ounce, the price of gold is up over 19%*. Meanwhile, gold miners, as represented by the VanEck Gold Miners ETF (GDX), have underperformed the price of the yellow metal, and this is odd because in the past when the price of gold rises, it was not uncommon for the price of miners to outpace the metal.
For savvy investors, this disparity creates an opportunity. We think the anomaly is more extreme given that over the past decade miners have strengthened balance sheets and improved cash flow generation.
The gold price has shot up in 2024 following markets ramping up policy rate cut bets in 2024. Since its October 2023 low of US$1,819.45, it is up over 19%*. It’s been a big gain, but there could be more to go. Looking back since 2000, the price momentum following a spike of this magnitude (initially greater than 15% in 90 days) has resulted in strong gains. Naturally, we always caution that past performance is not a reliable indicator of future performance.
Chart 1: The gold price and momentum of rallies
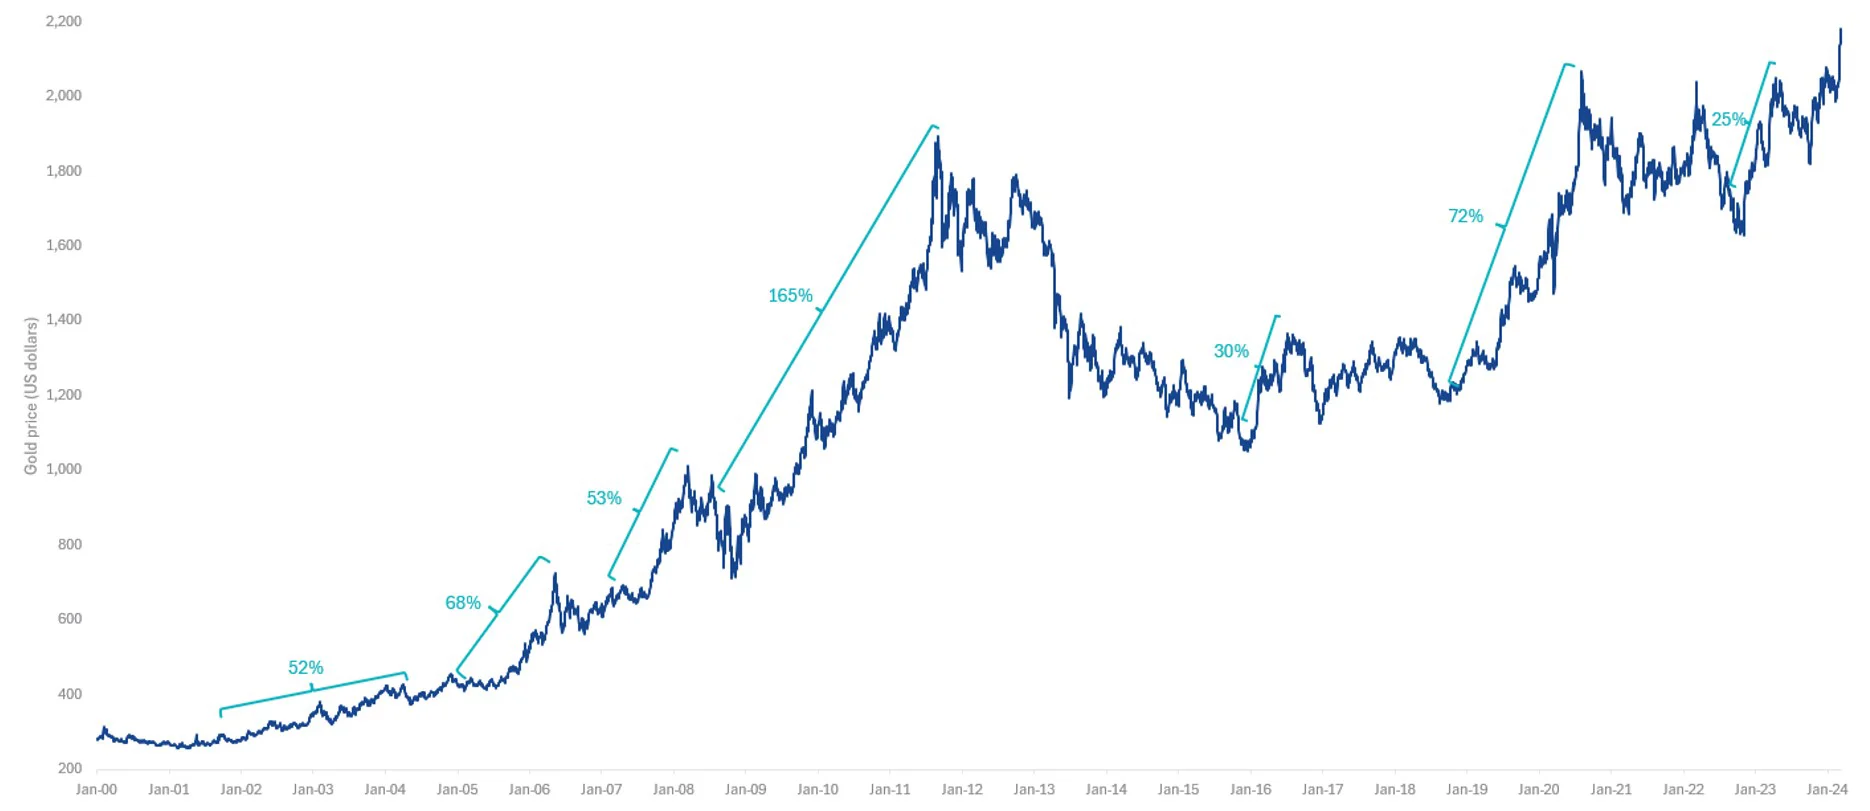
Source: Bloomberg, VanEck. Past performance is not a reliable indicator of future performance. You cannot invest in an index. Results are calculated to the last day of the and exclude costs associated with investing in an index.
Miners have disconnected from the gold price
The index that the VanEck Gold Miners ETF (GDX) tracks, the NYSE Arca Gold Miners Index (GDX Index), was launched in 2004. If we overlay the returns of gold with the returns of the GDX Index, it has generally been the case that when the gold price has risen, the price of its miners has risen more, and conversely, when the price of gold has fallen, its miners have fallen further. There was a disconnect in that relationship in 2011, but it wasn’t long before the two started to move as they had before that date. In 2023 that relationship disconnected again, as the gold price rose, the price of gold miners fell.
Chart 2: While gold miners’ performance has traditionally correlated to the gold price, there have been two notable exceptions
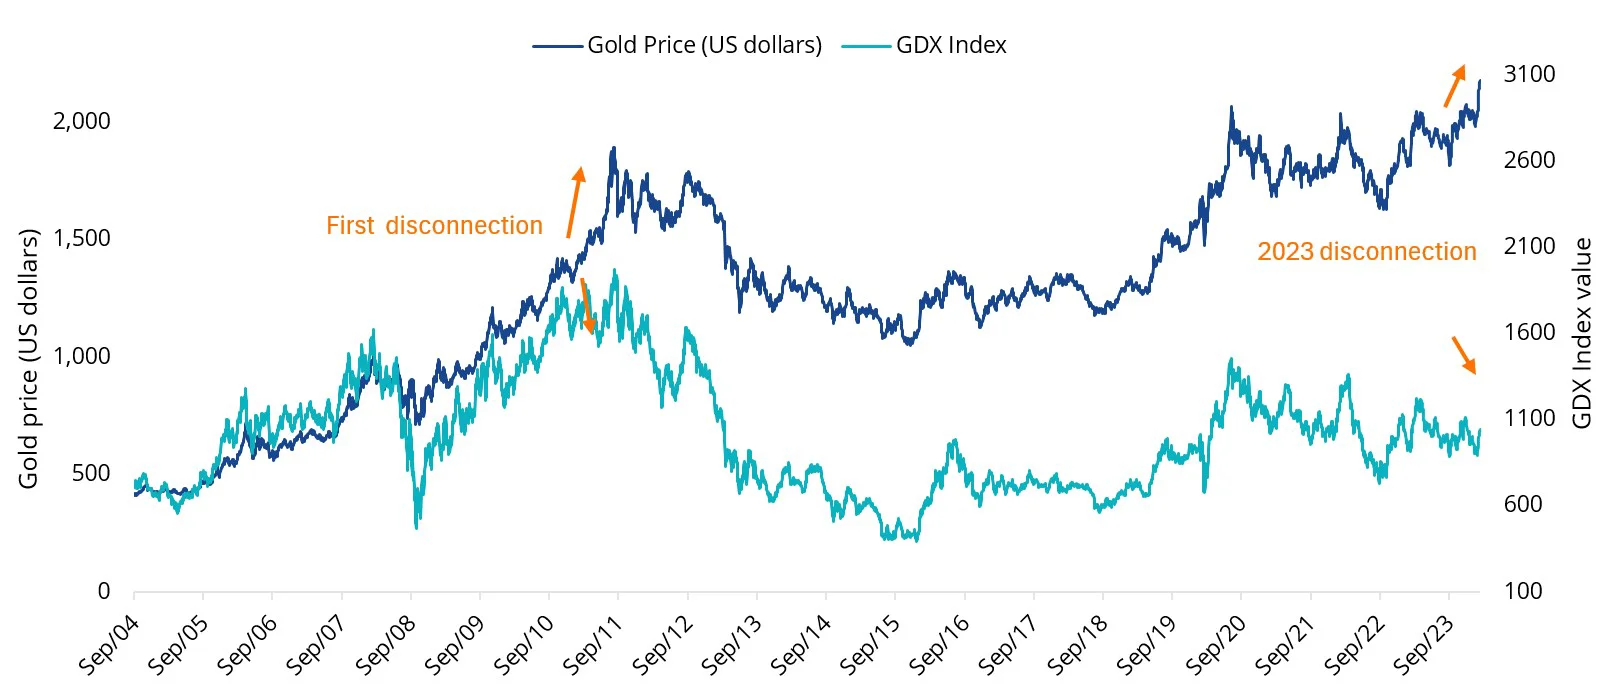
Source: Bloomberg, VanEck. Past performance is not a reliable indicator of future performance. You cannot invest in an index.
We think, in the first half of 2023 miners were oversold, and unlike in 2011, overall, gold miners are better run, more efficient operations. Should the gold price continue to rise, its miners’ returns could be amplified.
Gold miners have retained healthy margins, despite recent inflation
In terms of being better run, miners have not been immune from inflation and the all-in-sustaining costs have risen for gold miners since 2016. But now disciplined mining companies can generate a substantial amount of free cash flow.
Chart 3: Average all-in sustaining costs* versus average annual gold price (US dollars/oz)
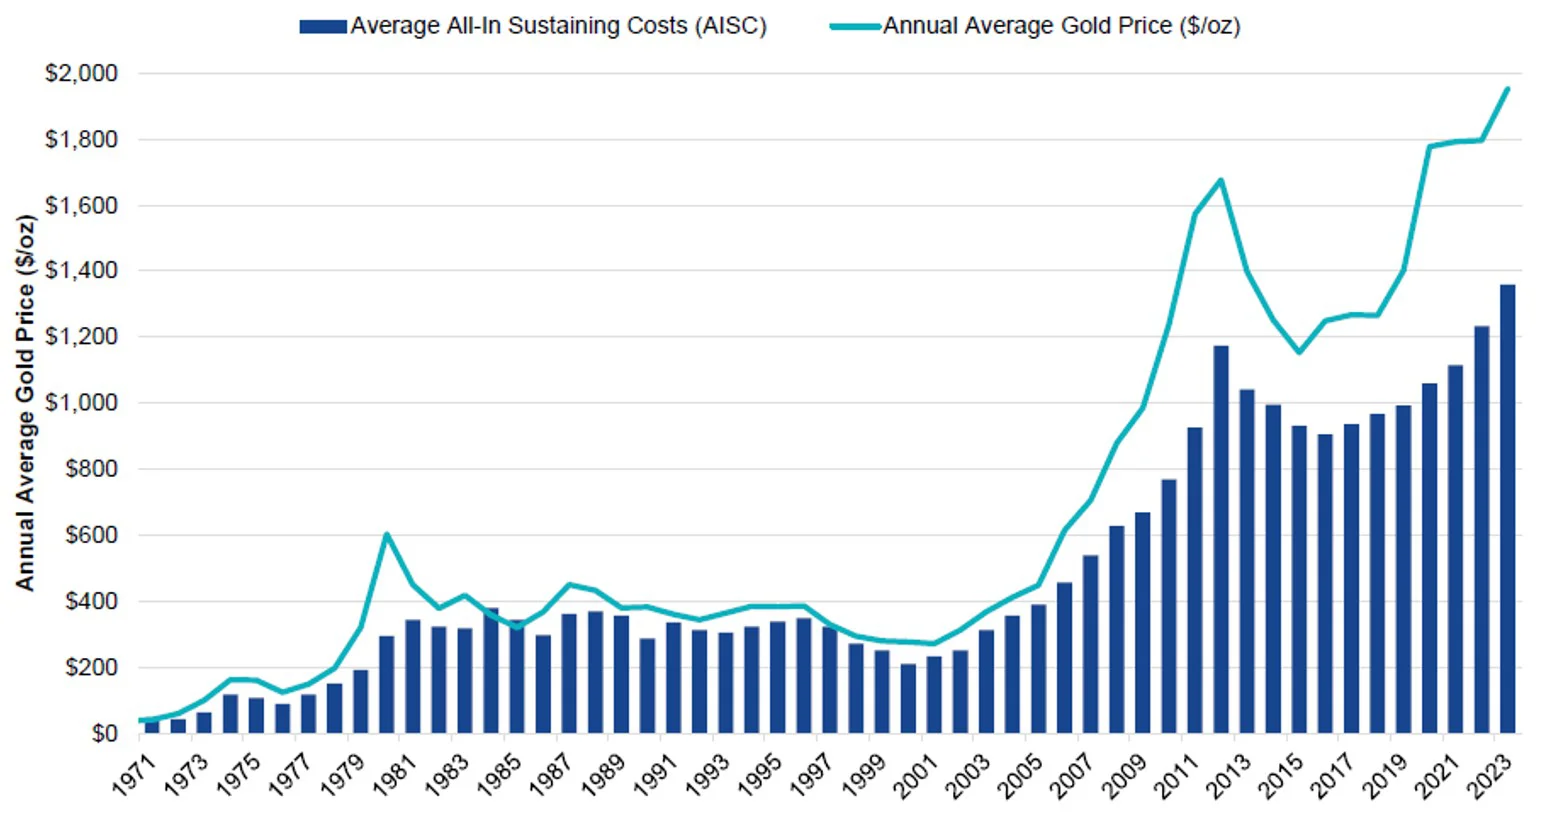
Source: Scotiabank. Data as of December 31, 2023. *All-in-sustaining costs (AISC) reflecting the full cost of gold production from current operations, including adjusted operating costs, sustaining capital expenditure, corporate general and administrative expenses and exploration expenses. Past performance is not indicative of future results.
Over the past five years, a persistent focus on debt reduction and free cash flow generation has fundamentally transformed how these companies look from both an absolute and relative valuation perspective. Gold miners are making a strong case for value investors right now.
Chart 4: Gold miners* free cash flow margin and net debt/EBITDA
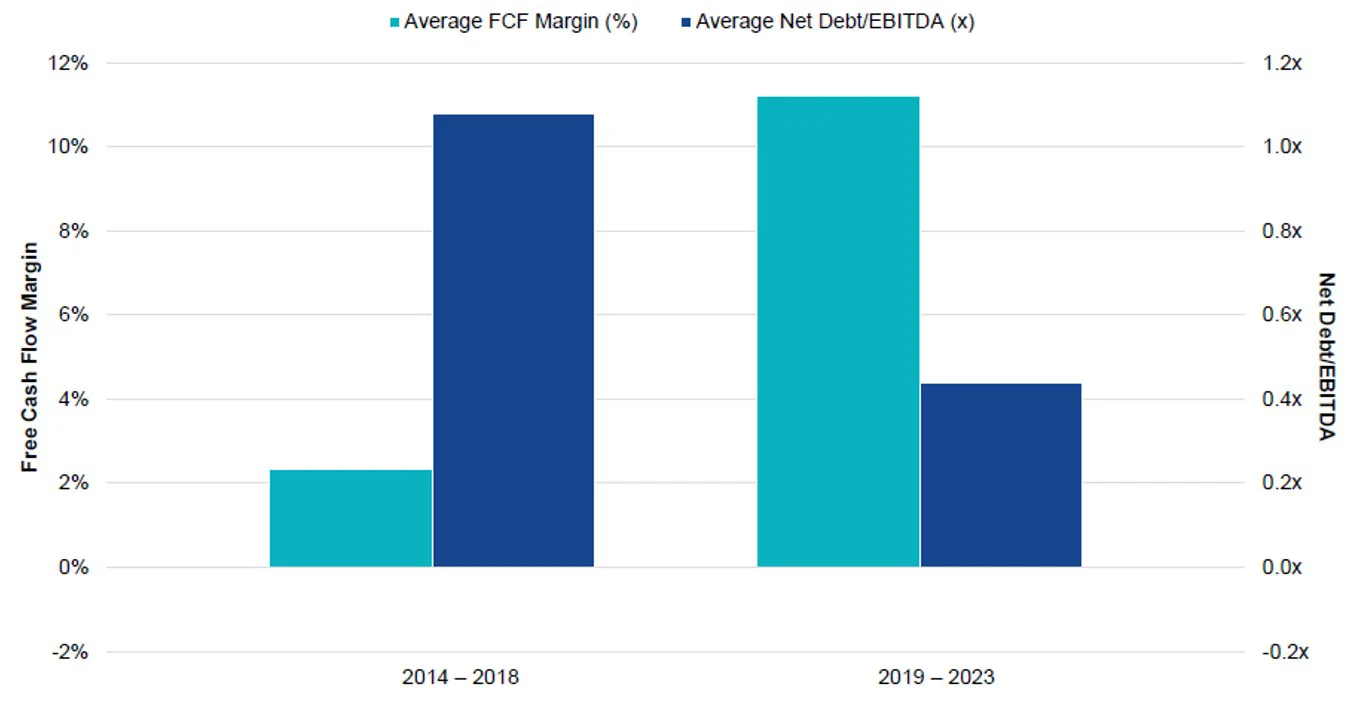
Source: FactSet, VanEck. Data as of December 2023 *“Gold Miners” = NYSE Arca Gold Miners Index.
Gold miners’ valuations
Despite the strength of gold mining sector’s balance sheets, cash flow generation and capital allocation strategies being as strong as they have ever been they are trading at well below historical averages. You can see this in Chart 5 below, which shows the value of gold mining equity, measured using the GDX Index relative to the gold price.
Chart 5: Gold companies are relatively cheap at current levels
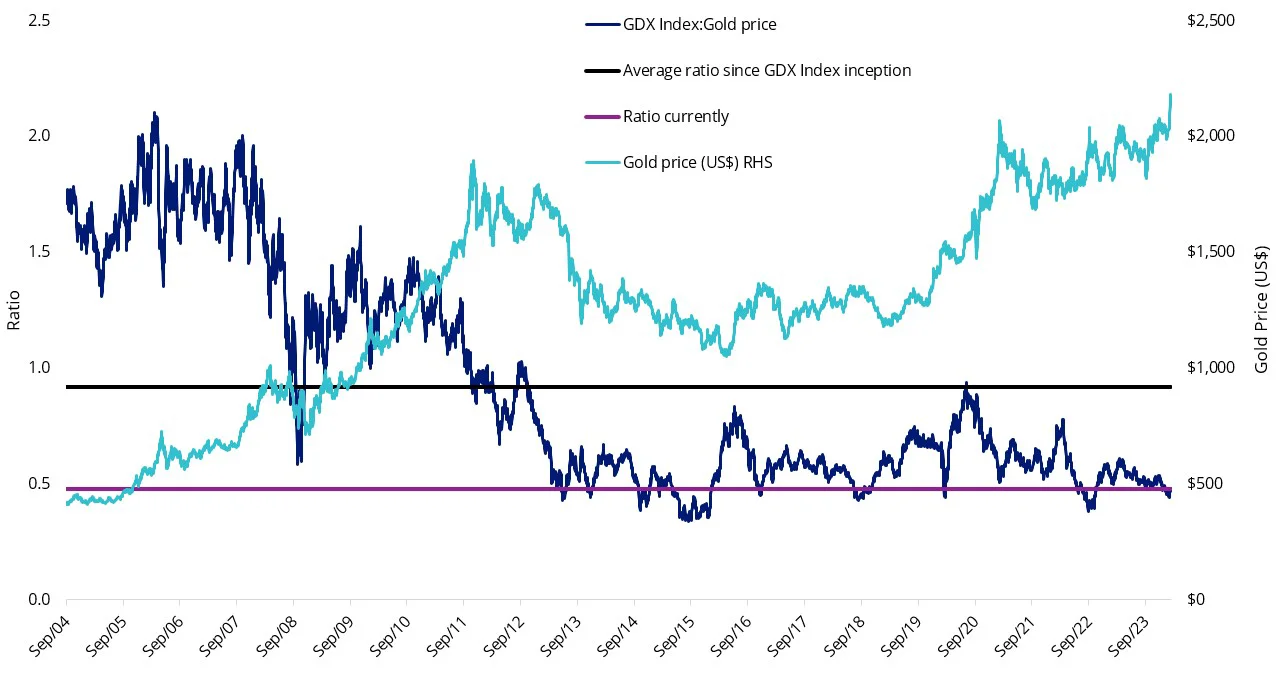
Source: Bloomberg, VanEck, as of 11 March 2024. All figures in US dollars. GDX Index Inception is 29 September 2004. GDX Index is the NYSE Arca Gold Miners Index. You cannot invest directly in an index. Past performance is not a reliable indicator of future performance.
Since the beginning of the month, GDX has risen by 10.92% and we think this could be the beginning of a reversion-to-the-mean trend that sees gold mining equities once again display their leverage to the gold price and outperform bullion when gold prices are rising. It still has a long way to go, you can see that over six months, the gold price has risen 10.10%, but GDX has only returned 1.62%.
Table 1: GDX performance and the performance of the LBMA Gold Price PM
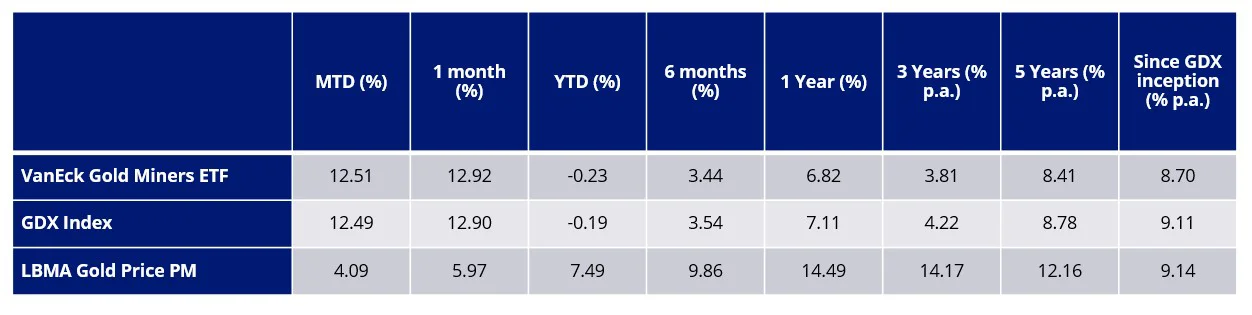
Source: Morningstar Direct as at 13 March 2024. GDX inception date is 26 June 2015 and a copy of the factsheet is here. The table above shows past performance of GDX from 26 June 2015. Results are calculated to the last business day of the month and assume immediate reinvestment of distributions. GDX results are net of management fees and costs, but before brokerage fees or bid/ask spreads incurred when investors buy/sell on the ASX. Returns for periods longer than one year are annualised. Past performance is not a reliable indicator of current or future performance which may be lower or higher.
GDX invests directly in the underlying securities that comprise the GDX Index. GDX acted as a ‘feeder fund’ from 9th October 2019 – 11 May 2022 giving investors access to a fund domiciled in the United States. From 26 June 2015 – 8th October 2019, the fund operated as a CDI.
Accessing gold with the specialists
VanEck’s global leadership in gold investing stretches more than 50 years, encompassing gold equites and bullion across ETFs and active funds. Two ETFs for portfolio consideration:
- GDX – investing in a diversified portfolio of gold mining companies
- NUGG – accessing physical gold, that ‘delivers’
*Source: Morningstar, all performance as at 13 March 2024. Past performance is not indicative of future results.
Published: 22 March 2024
Any views expressed are opinions of the author at the time of writing and is not a recommendation to act.
VanEck Investments Limited (ACN 146 596 116 AFSL 416755) (VanEck) is the issuer and responsible entity of all VanEck exchange traded funds (Funds) trading on the ASX. This is general advice only and does not take into account any person’s financial objectives, situation or needs. The product disclosure statement (PDS) and the target market determination (TMD) for all Funds are available at vaneck.com.au. You should consider whether or not an investment in any Fund is appropriate for you. Investments in a Fund involve risks associated with financial markets. These risks vary depending on a Fund’s investment objective. Refer to the applicable PDS and TMD for more details on risks. Investment returns and capital are not guaranteed.
NYSE® Arca Gold Miners Index® is a trademark of ICE Data Indices, LLC or its affiliates (“ICE Data”) and has been licensed for use by VanEck in connection with the US Fund. Neither the Trust nor the Fund is sponsored, endorsed, sold or promoted by ICE Data. ICE Data makes no representations or warranties regarding the Trust or the Fund or the ability of the NYSE Arca Gold Miners Index to track general stock market performance.
ICE DATA MAKES NO EXPRESS OR IMPLIED WARRANTIES, AND HEREBY EXPRESSLY DISCLAIMS ALL WARRANTIES OF MERCHANTABILITY OR FITNESS FOR A PARTICULAR PURPOSE WITH RESPECT TO THE NYSE ARCA GOLD MINERS INDEX OR ANY DATA INCLUDED THEREIN. IN NO EVENT SHALL ICE DATA HAVE ANY LIABILITY FOR ANY SPECIAL, PUNITIVE, INDIRECT, OR CONSEQUENTIAL DAMAGES (INCLUDING LOST PROFITS), EVEN IF NOTIFIED OF THE POSSIBILITY OF SUCH DAMAGES.