Bubble or boom?
Tech stocks have continued to perform strongly this year despite COVID-19. The MSCI USA Information Technology Index is up 34.7% calendar year to 6 November 2020. There is one big question on everyone’s mind: is this another tech bubble?
Two decades later, are we heading for another tech bubble burst?
Tech stocks have continued to perform strongly this year despite COVID-19. The MSCI USA Information Technology Index is up 34.7% calendar year to 6 November 2020. There is one big question on everyone’s mind: is this another tech bubble?
There are two camps with different views. Those who believe that tech has run too far and those who believe it still offers value.
The overvalued camp are seeing clear parallels between the 1999/2000 tech bubble and today. The divergence between price and trend earnings opened up after the Fed pivoted away from raising rates in January 2019. The chart below shows the divergence. While the gap between price and earnings is not quite as extreme as the 1999/2000 period, it is still large in historical terms.
Figure 1: Information Technology Performance vs Earnings Growth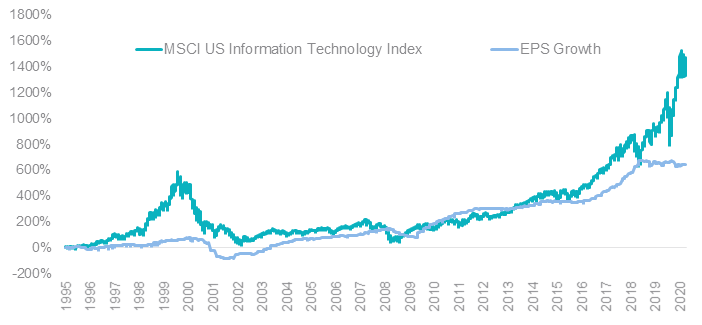
Source: Bloomberg, 31 October 2020
On an outright basis, the multiples of book, sales, earnings and cash flow are also approaching 1999/2000 levels.
Enterprise value to sales is 6.6 compared to the peak of 7.7 times in 2000.
Figure 2: MSCI USA Information Technology EV/Sales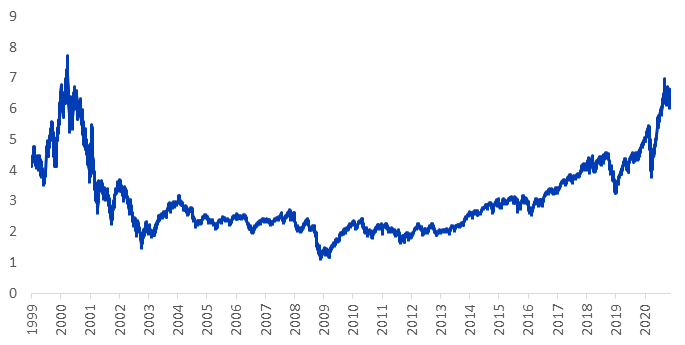
Source: Bloomberg, 31 October 2020
Although there are some similarities between 1999/2000 and now, there are two key significant differences which lead other investors to conclude that tech stock still offer good value. These include:
- The US Fed rate peaked at 6.5% in June 2000, it is now a mere 0.25%. Similarly long term bond rates which are factored into the discount rates used to value stocks are at historic lows. With such low rates it’s difficult to determine the appropriate P/E rate and other fundamental ratios.
- The tech companies of today are very different from those in 1999/2000. The major companies on an individual basis are not as extreme while the mega cap technology companies are making profits and have cash on their balance sheets.
Whether you believe tech is overvalued or still has a way to run, there are global equity ETFs that offer differing exposures to tech stocks.
For those in the overvalued camp, the VanEck Vectors Morningstar World ex Australia Wide Moat ETF (ASX code: GOAT) is 4% underweight to the tech sector relative to the MSCI World ex-Australia Index. For those who feel there is more value to come, the VanEck Vectors MSCI World ex-Australia Quality ETF (ASX code: QUAL) is currently 13% overweight to tech when compared to the MSCI World ex-Australia Index.


Published: 12 November 2020
An investment in GOAT or QUAL carries risks associated with: financial markets generally, individual company management, industry sectors, ASX trading time differences, foreign currency, country or sector concentration, political, regulatory and tax risks, fund operations and tracking an index. See the PDS for details.