History repeats itself
Over the past three months, emerging markets (EM) equities have underperformed their developed market counterparts, amid concerns that EM equities would be hit hard in the COVID-19 induced global shutdown. However, the unprecedented stimulus policies in developed markets could end up being positive for emerging markets.
Despite recent underperformance, emerging markets look compelling from a valuation standpoint and could benefit from the unprecedented stimulus policies.
EM equities were among the worst hit as global markets sold off in response to the COVID-19 pandemic. The response from policy makers in developed markets has been swift and sizable. Investors have been concerned that emerging markets, which generally have less domestic policy firepower and flexibility in this crisis, have been more restrained. However, emerging markets benefit from the stimulus in developed markets because they are linked to final demand in the developed world via the raw materials and the technology they produce and they are impacted by the value of the US dollar, as the reserve currency. Therefore, this unprecedented policy stimulus supports external demand for emerging economies and it will push down the value of the US dollar which is beneficial for emerging markets growth.
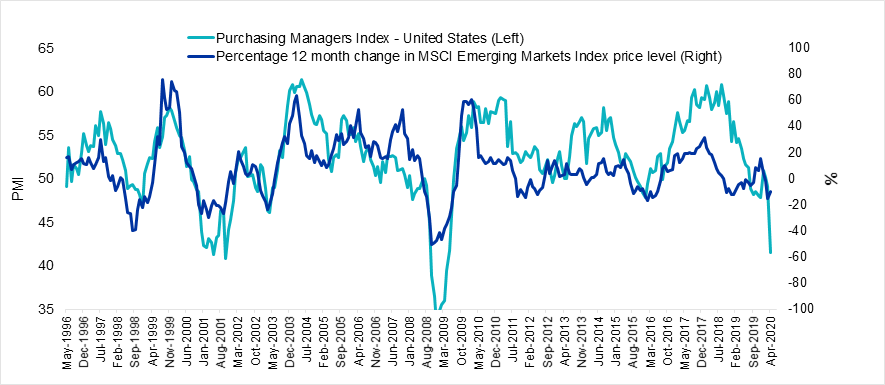
The correlation between the performance of the MSCI Emerging Markets Index and the US Institute of Supply Management (ISM) Manufacturing Purchasing Managers Index (PMI) has been high and this crisis has been no different. However should US manufacturing PMIs turnaround, EM markets could potentially follow suit.
Chart 1: US ISM Manufacturing PMI and MSCI Emerging Markets Index

Source: FactSet,1 May 1996 to 1 May 2020.
Since 2001, emerging markets have outperformed developed markets, though it has been a wild ride. Australian investors with global equity portfolios that had exposure to EM equities were rewarded in the lead up to the GFC (2001 to 2007 below) benefiting from the emerging markets boom. They then underperformed, prior to a stellar year in 2017. Since then, emerging markets have underperformed developed markets as the US dollar strengthened. However, with greater policy stimulus in developed markets it is expected there will be pressure on the US dollar. This bodes well for emerging markets.
Table 1: Annualised and cumulative returns for emerging markets versus developed markets over past 20 years
|
|
Annualised returns |
Cumulative returns |
||
|
|
MSCI Emerging Markets Index |
MSCI World ex Australia Index |
MSCI Emerging Markets Index |
MSCI World ex Australia Index |
|
2001 to 2007 |
15.80% p.a. |
-1.43% p.a. |
179.26% |
-9.56% |
|
2008 to 2016 |
0.48% p.a. |
5.56% p.a. |
4.37% |
62.74% |
|
2017 |
27.09% p.a. |
13.38% p.a. |
27.09% |
13.38% |
|
2018 to 2020 May |
-0.27% p.a. |
10.40% p.a. |
0.01% |
26.66% |
|
Performance 2001 to 2020 May |
6.59% p.a. |
3.95% p.a. |
271.11% |
166.88% |
Source: Bloomberg, Morningstar Direct. Performance results shown are for indices and not EMKT. You cannot invest in an index. Data is in Australian dollars. Cumulative returns are calculated monthly and assume immediate reinvestment of all dividends. Past performance of the indices is not a reliable indicator of future performance of EMKT.
Valuations are compelling
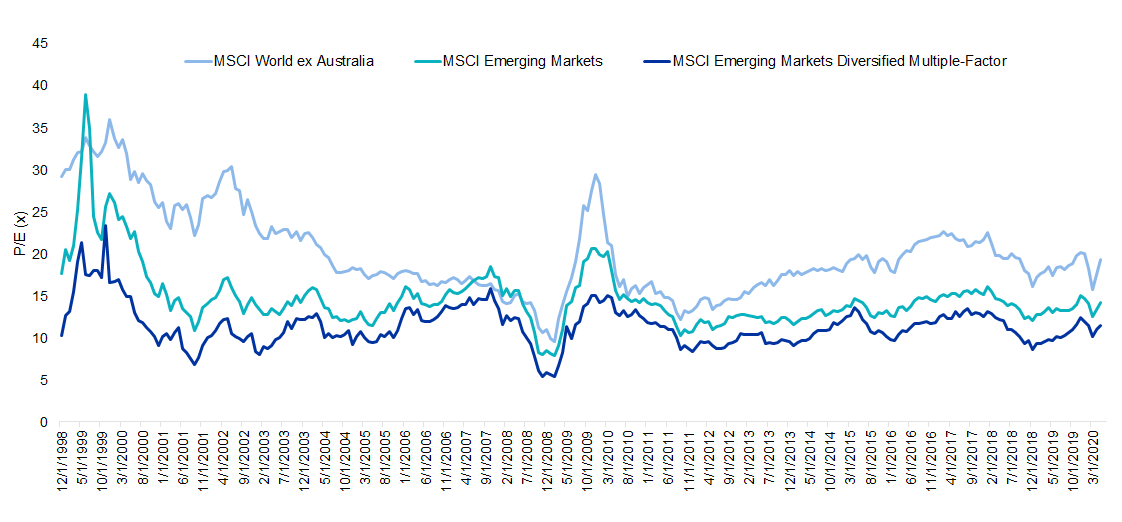
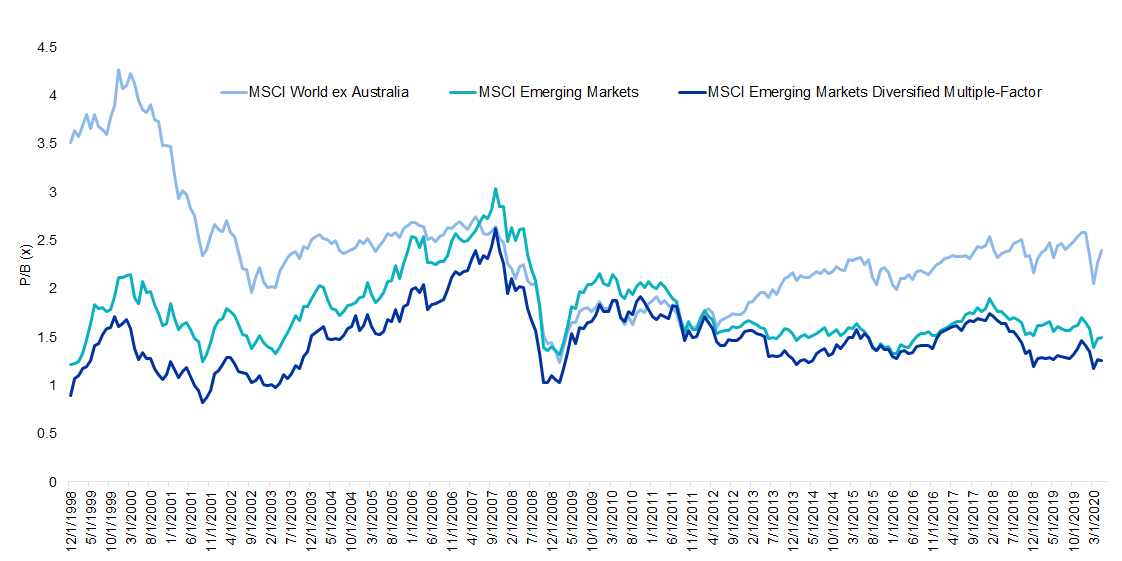
Right now, EM equities look compelling from a valuation standpoint and are trading at a significant discount to companies in developed markets. EM equities are currently trading at 37% and 24% discount on a price-to-book basis and price-to-earnings basis to developed markets respectively and are nearly at the bottom of the long term range, unlike developed markets which have bounced back more and are trading at historically high ratios.
Chart 2: Relative P/E of developed markets and emerging markets
Source: MSCI, 31 December 1998 to 31 May 2020
Chart 3: Relative P/B of developed markets and emerging markets
Source: MSCI, 31 December 1998 to 31 May 2020.
A smarter way to invest in EM equities
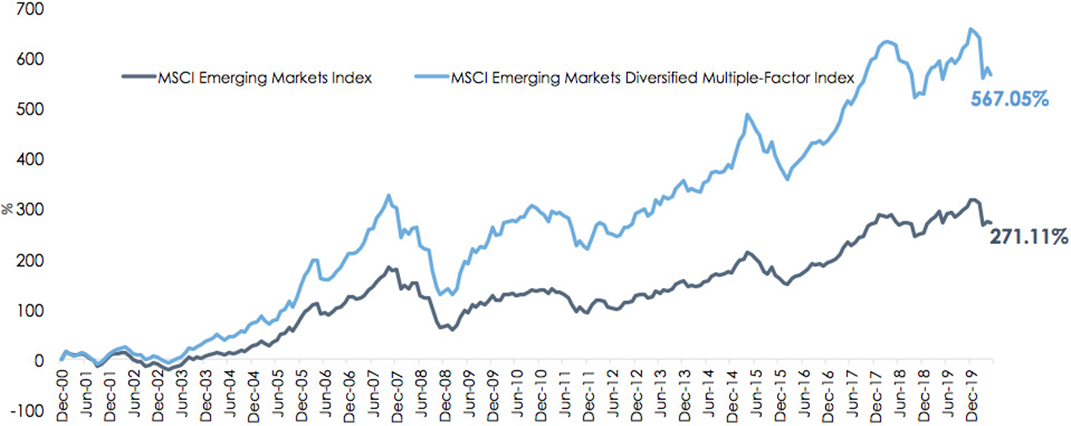
Investing in emerging markets has traditionally been expensive and returns among active managers vary significantly from year-to-year because it is almost impossible for active managers to time factors in emerging markets. Over the long term, a multi-factor approach has exhibited significant outperformance. This is illustrated in the below chart.
Chart 4: MSCI Emerging Markets Diversified Multiple-Factor Index performance since inception to 31 May 2020.

Source: Morningstar. This graph shows the performance of the MSCI Emerging Markets Diversified Multiple-Factor Index (EMKT Index) since inception versus the MSCI Emerging Markets Index. Performance has been converted to Australian dollars. You cannot invest directly in an index. Results assume investment at NAV and reflect capital appreciation and immediate reinvestment of dividends and capital gains, EMKT Index inception date is 29 December 2000. Past performance of the EMKT Index is not a reliable indicator of future performance of EMKT. The EMKT Index was launched on Feb 17, 2015. Data prior to the launch date is back-tested data.
Accessing EM equities
The VanEck Vectors MSCI Multifactor Emerging Markets Equity ETF (ASX: EMKT) tracks the MSCI Emerging Markets Diversified Multiple-Factor Index (EMKT Index) and provides investors with access to a diversified portfolio of emerging markets companies that demonstrate four factors: Value, Momentum, Low Size and Quality.
Published: 30 June 2020
IMPORTANT NOTICE: This information is issued by VanEck Investments Limited ABN 22 146 596 116 AFSL 416755 ('VanEck) as the responsible entity and issuer of VanEck Vectors MSCI Multifactor Emerging Markets Equity ETF ARSN 623 953 631 (“the Fund”).
This is general advice only about financial products and not personal advice. It does not take into account any person’s individual objectives, financial situation or needs. Before making an investment decision investors should read the product disclosure statement and with the assistance of a financial adviser consider if it is appropriate for their circumstances. A copy of the PDS is available at https://www.vaneck.com.au/emkt.
An investment in EMKT has specific and heightened risks that are in addition to the typical risks associated with investing in the Australian market. These include: currency risks from foreign exchange fluctuations; ASX trading time differences; changes in foreign laws and regulations including foreign exchange controls; application of foreign tax legislation including confiscatory taxation and withholding taxes; changes in government administration and economic monetary policy; appropriation; changed circumstances in dealings between nations; lack of uniform accounting and auditing standards; potential difficulties in enforcing contractual obligations; and extended settlement periods.
The Fund is also subject to investment risk, including possible loss of capital invested. Past performance is not a reliable indicator of future performance. No member of the VanEck group guarantees the repayment of capital, the payment of income, performance, or any particular rate of return from the Fund.
EMKT is indexed to a MSCI index. EMKT is not sponsored, endorsed, or promoted by MSCI, and MSCI bears no liability with respect to EMKT or the MSCI Index. The PDS contains a more detailed description of the limited relationship MSCI has with VanEck and EMKT.


