More than meets the AI
Companies with high margins, strong cash flows and low leverage with some even having cash at the bank, are better placed to manage slowdowns in the macroeconomic environment. Semiconductor company Nvidia is one such business, exemplifying many of the characteristics typical of ‘quality’ companies. As recession talk increases, it’s these companies’ that smart investors prefer and their reasoning is justified.
Quality investing, defined as investing in stocks that have high return on equity (ROE), sustainable earnings and low financial leverage, has historically been a go-to strategy for those astute investors seeking long-term outperformance. Nvidia epitomises many of these traits. The company currently has a strong balance sheet and has just revealed a blockbuster revenue target of $11 billion in sales for the quarter ending July, far exceeding the consensus forecast of around $7 billion. Nvidia has gained more than $650 billion in market value since October last year.
The ultimate quality company
Nvidia has for years made the computer chips that power graphics-heavy games also known as graphics processing units (GPUs). But several years ago, artificial intelligence (AI) researchers began using those same chips to run powerful new algorithms that were causing breakthroughs in the field.
As companies race to develop their AI programs, Nvidia is currently the only viable supplier of the GPUs needed to power such programs according to analysts interviewed by the Wall Street Journal (WSJ).
Management consultant McKinsey & Company valued the global semiconductor market at $600 billion in 2021. The same report predicts annual growth of 6% to 8% for the next several years. At that rate, the industry will reach $1 trillion by 2030.
Nvidia’s share price has rocketed 159% this year, nearly tripling and briefly reaching a $1 trillion market in late May. The company is the best performer on the S&P500 year to date and is the first chip company to ever reach the trillion-dollar mark. Nvidia has been able to double prices because of the overwhelming demand for GPUs. The stock now trades at 48 times forward earnings, up from 27 times last year.
Analysts at US Investment Bank Stifel recently said, “we absolutely think Nvidia’s the best-positioned semiconductor company.” Ignoring the current buzz surrounding the company, Nvidia has a proven track record of identifying innovation opportunities that can open up markets and unlock value and could drive growth in AI and related innovations to new heights, as it did in gaming. That potential excites many investors—hence the company's very high P/E ratio.
Meanwhile, enthusiasm for Nvidia among stock pickers has only grown as investors have piled in. According to the WSJ of the 49 analysts surveyed by FactSet, 41 have a buy rating on the stock. That is up from 30 in October last year.
Figure 1: Share of Wall street stock analysts with buy ratings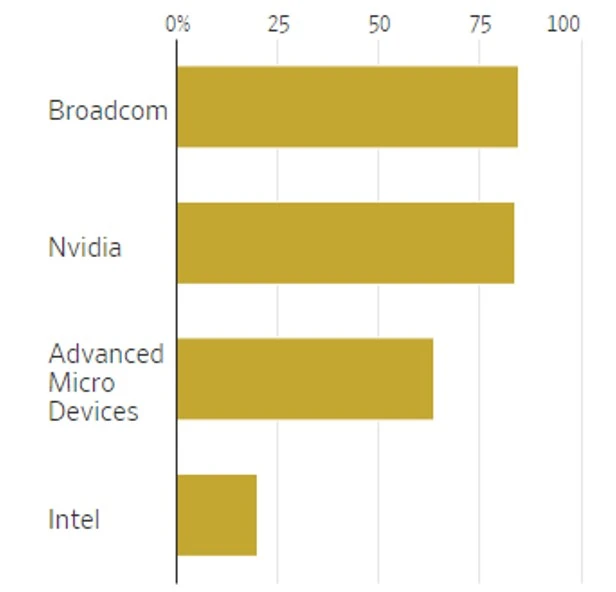
Source: Factset. This is not a recommendation to act.
Nvidia was added to VanEck’s MSCI International Quality ETF in 2016, long before its recent dizzying rise. QUAL tracks the MSCI World ex Australia Quality Index (QUAL Index).
Performance in bull and bear markets
Over the long term, QUAL Index has demonstrated outperformance versus the MSCI World ex Australia Index. Notably, QUAL Index has significantly outperformed in previous down-market environments that have correlated with economic slowdowns such as the period during the dot-com bubble, the GFC and the low growth environment that typified the GFC bull market, as the chart below shows. As always, past performance is not indicative of future performance.
Figure 2: Quality Index performance
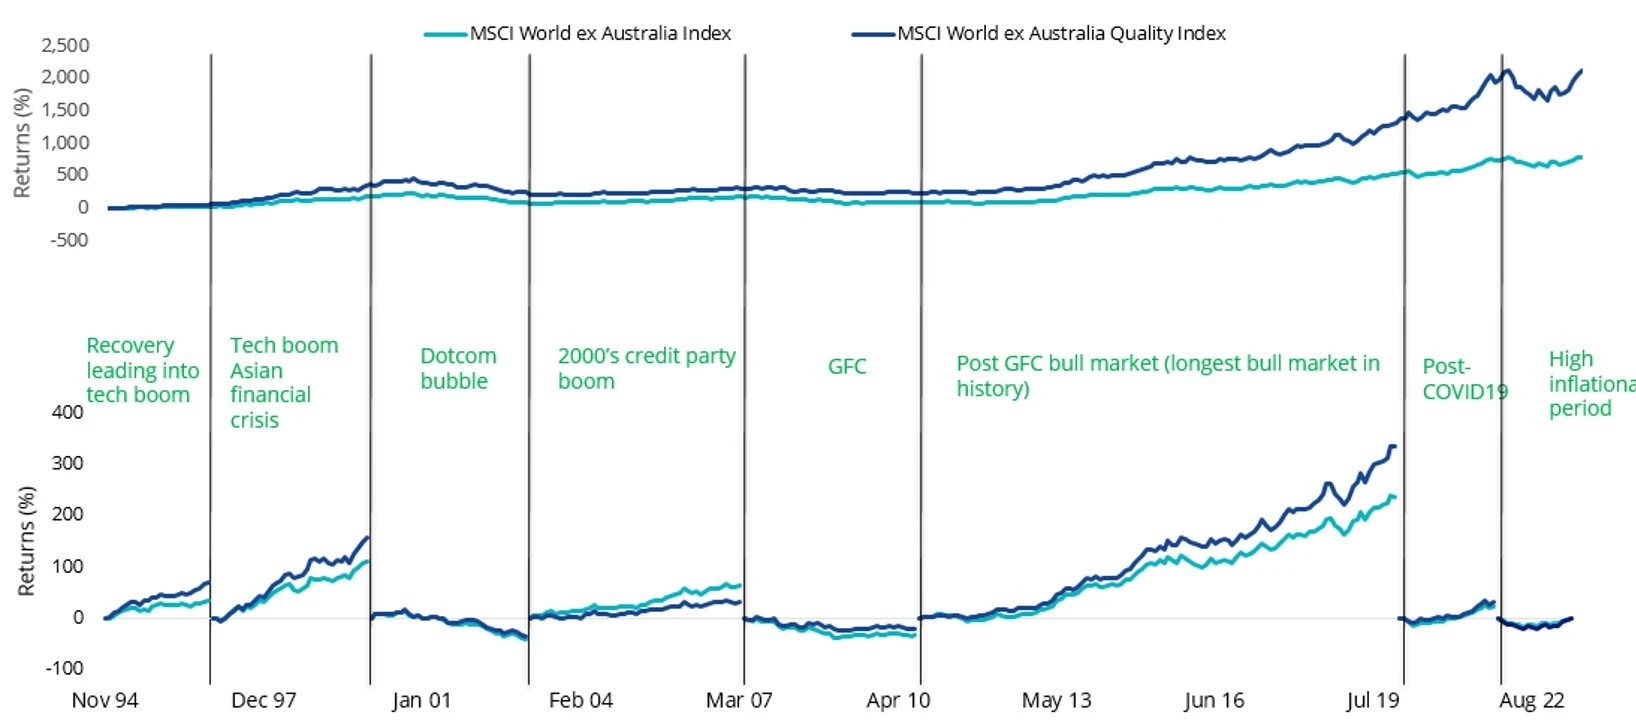
Source: Morningstar Direct, VanEck. 30 November 1994 – 31 May 2023. The above graph is a hypothetical comparison of performance of the Index and the parent index. Results are calculated to the last business day of the month and assume immediate reinvestment of all dividends and exclude costs associated with investing in the ETF. You cannot invest directly in the Index. The above performance information is not a reliable indicator of current or future performance of the indices or QUAL, which may be lower or higher. The MSCI World ex Australia Index (“MSCI World ex Aus”) is shown for comparison purposes as it is the widely recognised benchmark used to measure the performance of developed market large- and mid-cap companies, weighted by market capitalisation. QUAL’s index measures the performance of 300 companies selected from MSCI World ex Aus based on MSCI quality scores, weighted by market cap x quality score at rebalance. Consequently, QUAL’s index has fewer companies and different country and industry allocations than MSCI World ex Aus. Click here for more details.
Inflation has remained sticky through 2023 and developed market central banks have been raising rates to fight the spectre of uncontrollable growth. The fear is a ‘hard landing’. A hard landing refers to a period where the economy enters a recession following a series of central bank cash rate increases and it is the most common scenario following a Fed rate rising cycle (75 per cent of US monetary policy tightening cycles since 1955 have resulted in a recession).
Markets are on edge.
It is little wonder then why savvy investors are looking for opportunities, understanding they may not pick the bottom, but they were not going to pick the top either.
If the global economic recovery falters and we enter a recession, it could benefit quality companies, as they tend to offer investors relative protection during weaker economic environments and heightened market volatility.
Figure 3 illustrates how quality companies typically outperform when manufacturing activity (a proxy for economic activity) decelerates (orange) and/or contracts (purple).
Figure 3 – US ISM Manufacturing PMI Index and MSCI World Quality versus MSCI World performance
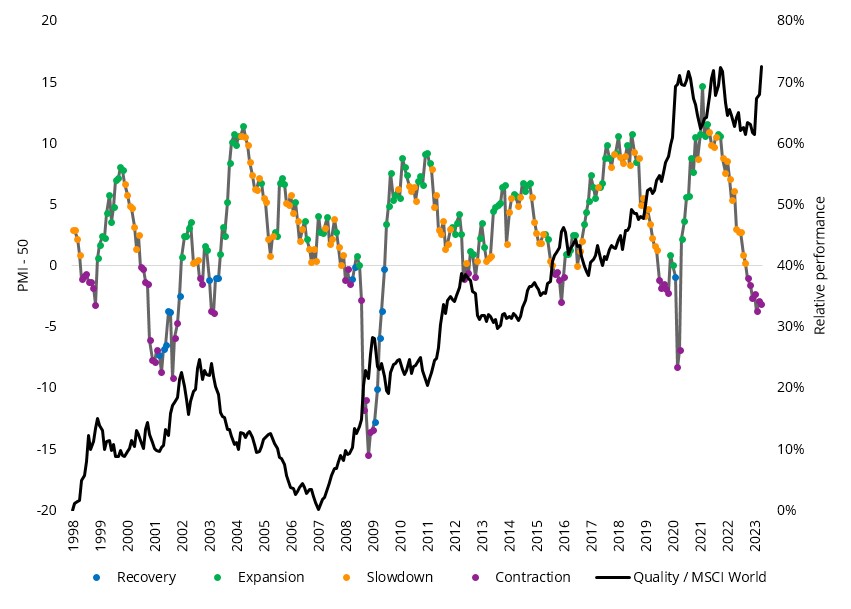
Table 1: Factor performance during different economic regimes
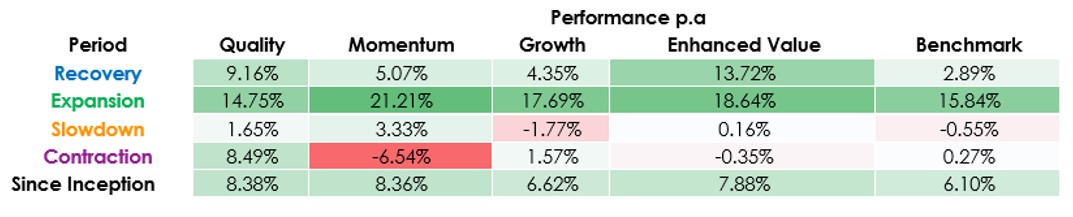
Figure 3 and Table 1 source: Bloomberg. MSCI. Since common inception (November 1997) to April 2023. Past performance is not a reliable indicator of future performance. Quality is represented by the MSCI World Quality Index, Momentum is MSCI World Momentum Index, Growth is MSCI World Growth Index, Enhanced Value is MSCI Enhanced Value Index and Benchmark is MSCI World Index.
Quality may outperform
In a low growth environment, companies that traditionally do well have the following characteristics:
- Persistent strong net margins
- Supported by cash at bank
In addition to:
- High return on equity (ROE);
- Sustainable earnings; and
- Low leverage.
Since its inception QUAL has consistently maintained higher net margins, relative to the benchmark index and has an increasing cash at bank which in addition to being an indicator of strong balance sheets is a good gauge of strong cashflows.
Figures 4: QUAL net margin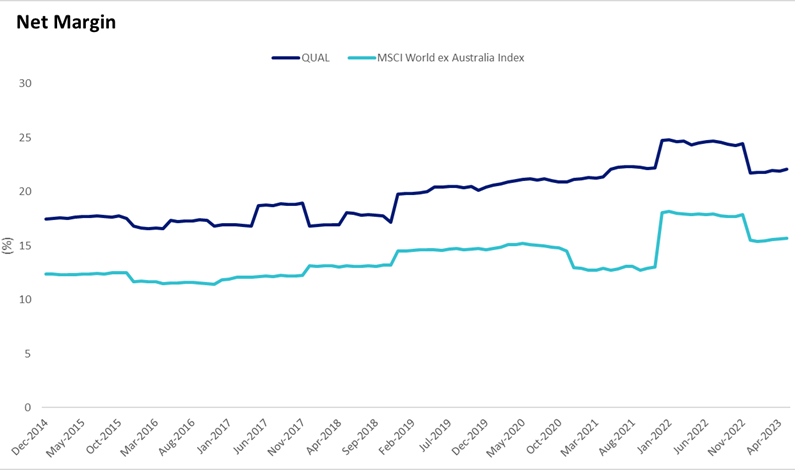
Figures 5: QUAL cash position
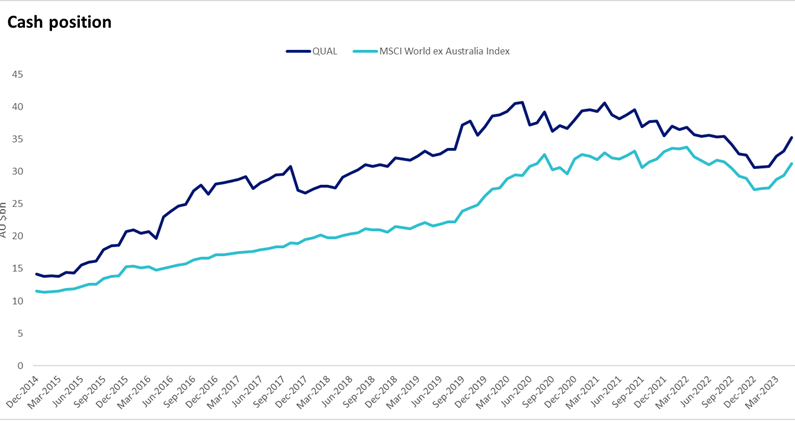
Source: FactSet, 31 December 2014 to 31 May 2023. Net margin is the percentage of total sales that is attributable to the company’s net income. Cash position represents the sum of cash and all short-term investments. The MSCI World ex Australia Index (“MSCI World ex Aus”) is shown for comparison purposes as it is the widely recognised benchmark used to measure the performance of developed market large- and mid-cap companies, weighted by market capitalisation. QUAL has fewer companies and different country and industry allocations than MSCI World ex Aus. Click here for more details.
In addition, QUAL tracks an index that only includes the 300 highest quality scoring stocks determined by MSCI based on three easily identifiable financial characteristics:
- High ROE;
- Stable year-on-year earnings growth; and
- Low financial leverage.
Figures 6 and 7: QUAL Index characteristics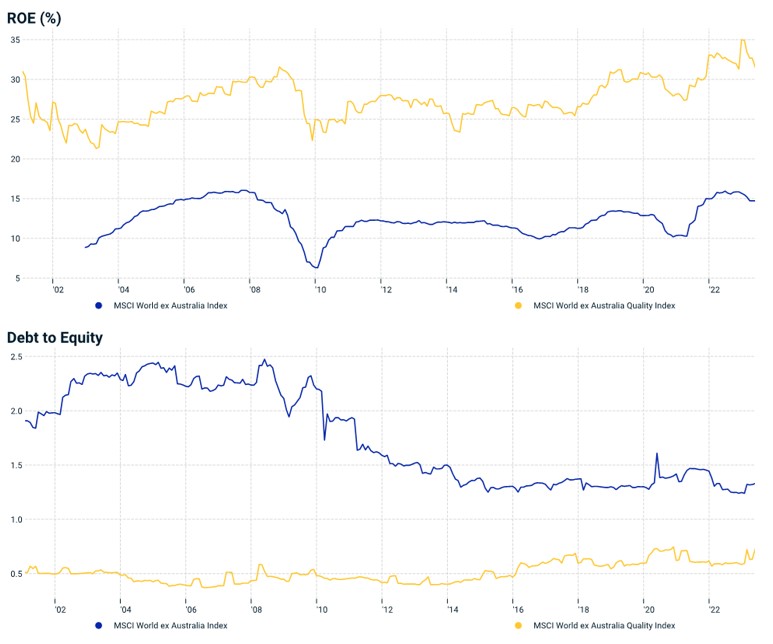
Source: MSCI, 31 December 1998 to 31 May 2023. Return on equity at an index level, calculated using the index earnings divided by the index book value. Leverage is the sum of the most recent book value of common equity plus preferred equity plus long-term debt, divided by book value of common equity. This is free-float market capitalisation weighted. The MSCI World ex Australia Index (“MSCI World ex Aus”) is shown for comparison purposes as it is the widely recognised benchmark used to measure the performance of developed market large- and mid-cap companies, weighted by market capitalisation. QUAL’s index measures the performance of 300 companies selected from MSCI World ex Aus based on MSCI quality scores, weighted by market cap x quality score at rebalance. Consequently, QUAL’s index has fewer companies and different country and industry allocations than MSCI World ex Aus. Click here for more details.
For more information about the Quality Factor’s performance in different economic regimes you can download our brochure here.
QUAL has delivered long-term outperformance
Since its inception on 29 October 2014 to 31 May 2023, QUAL has returned 15.10% p.a., outstripping the standard industry benchmark, the MSCI World ex Australia Index, by 2.87% p.a. As always past performance is not a reliable indicator of future performance.
Table 2 - QUAL Performance to 31 May 2023
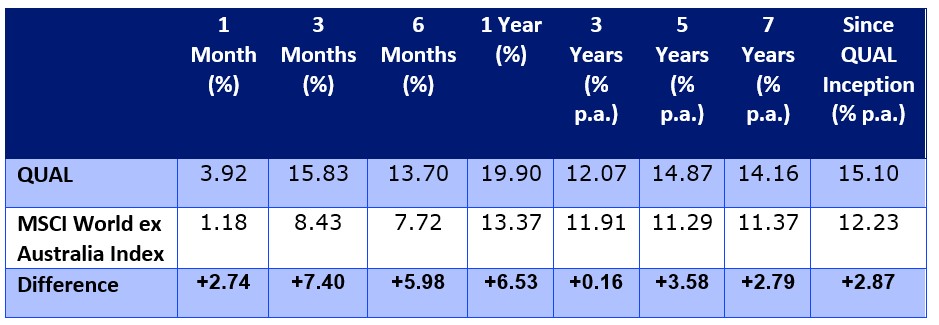
*Inception date is 29 October 2014. Source: Morningstar Direct, VanEck. The chart above shows past performance of QUAL and of the MSCI World ex Australia Index. You cannot invest directly in an index. Results are calculated to the last business day of the month and assume immediate reinvestment of distributions. QUAL results are net of management fees and other costs incurred in the fund, but before brokerage fees and bid/ask spreads incurred when investors buy/sell on the ASX. Returns for periods longer than one year are annualised. Past performance is not a reliable indicator of future performance. The MSCI World ex Australia Index (“MSCI World ex Aus”) is shown for comparison purposes as it is the widely recognised benchmark used to measure the performance of developed market large- and mid-cap companies, weighted by market capitalisation. QUAL’s index measures the performance of 300 companies selected from MSCI World ex Aus based on MSCI quality scores, weighted by market cap x quality score at rebalance. Consequently QUAL’s index has fewer companies and different country and industry allocations than MSCI World ex Aus.
Last year, VanEck recently launched a microsite to help investors understand the quality factors – click here.
Key risks: An investment in QUAL and QHAL carries risks associated with ASX trading time differences, financial markets generally, individual company management, industry sectors, foreign currency, currency hedging, country or sector concentration, political, regulatory and tax risks, fund operations and tracking an index. See the PDS for details


Published: 19 June 2023
IMPORTANT NOTICE
VanEck Investments Limited (ACN 146 596 116 AFSL 416755) (‘VanEck’) is the issuer and responsible entity of all VanEck exchange traded funds (Funds) listed on the ASX. This is general advice only and does not take into account any person’s financial objectives, situation or needs. The product disclosure statement (PDS) and the target market determination (TMD) for all Funds are available at vaneck.com.au. You should consider whether or not any Fund is appropriate for you. Investments in a Fund involve risks associated with financial markets. These risks vary depending on a Fund’s investment objective. Refer to the applicable PDS and TMD for more details on risks. Investment returns and capital are not guaranteed.