Two investment strategies for investors during periods of heightened market stress
If you’re feeling a little jittery about your investments at the moment, you are not alone. Deputy RBA Governor Michelle Bullock recently described the global economy as being on a ‘knife edge.’ Investors are contesting with inflation, geo political risks and rising interest rates. However, should economic conditions decline further from here, a value or quality approach could once again pay off for defensive-minded investors.
Strategy 1. Quality
One of the defining features of US stock performance over the past ten years has been quality companies, think of the likes of Apple, Microsoft and Google. Quality companies have three main characteristics; high return on equity, stable earnings growth and a low financial leverage.
Macro headwinds across multiple geographic regions has elevated market volatility as represented by the Chicago Board Options Exchange's CBOE Volatility (VIX) Index, a measure of the stock market's expectation of volatility based on S&P 500 index. The latest reading is one standard deviation above historic levels or the highest in 11 years, excluding the COVID period.
Chart 1 – VIX index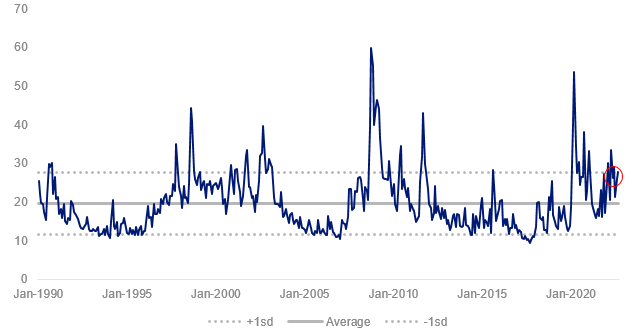
Source: Bloomberg
Chart 2 illustrates that quality companies outperformed during the dot com bubble burst, global financial crisis, Eurozone crisis, 2015/18 market shocks and coronavirus market drawdown.
Investors have historically sought out quality companies during periods of market volatility, also known as the ‘flight to quality’. Why? Companies with quality characteristics are better able to generate sustainable earnings amid a backdrop of stagnant economic growth.
Chart 2 – Relative performance of Quality companies versus VIX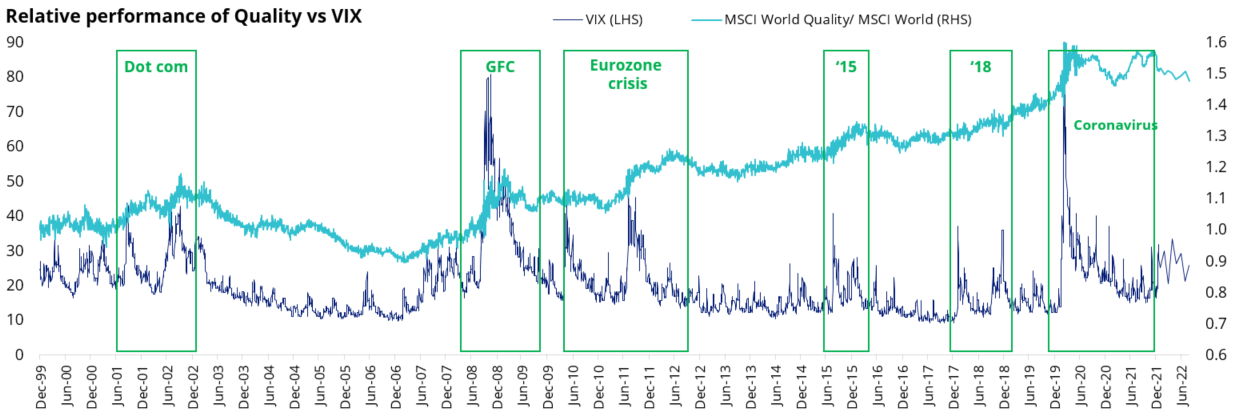
Source: MSCI Data/Calculations, Bloomberg, December 1998 to 31 August 2022. Chart shows performance of MSCI World ex Australia Quality relative to MSCI World ex Australia compared to VIX Index. Past performance is not indicative of future performance.
Access to quality companies
VanEck offers three ETFs that invest in quality companies which track MSCI Quality indices: The VanEck MSCI International Quality ETF (ASX: QUAL), an Australian dollar hedged version of QUAL which has ASX code: QHAL, and the VanEck MSCI International Small Companies Quality ETF (ASX:QSML).
Strategy 2. Value
Another way for investors to position their equity portfolios in the current bear market is to look for companies which represent good value. Historically, value companies have outperformed when inflation and interest rates increase, as they are less sensitive to changes in macroeconomic conditions.
The recent swift rise and fall in company valuations is similar to the experience following the dot com period, indicating that we may be in a similar asset-deflation bear market. This is where price to earnings valuations drop materially from a point where they were at record highs, as sentiment switches to investing in companies that have delivered sustainable earnings.
How did we get here
Following the emergence of COVID-19, central banks lowered policy rates to near zero and introduced quantitative easing measures that included buying government and corporate bonds to lower borrowing costs. Governments commenced expansionary fiscal measures including welfare payments for employees who faced hardships and business owners who were forced to close during lockdowns. Businesses were also offered tax breaks to encourage investment. These extreme measures fueled company valuations, notably the present value of growth/unprofitable technology companies given the abundance of ‘interest free cash’. MSCI World Growth price to earnings ratio reached an all-time index high of 48 times.
Chart 3 – MSCI World price to earnings comparison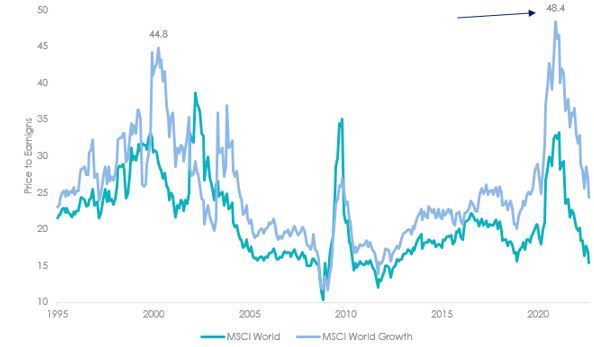
Source: Bloomberg. Past performance is not indicative of future performance.
What we have seen this year is a recalibration in asset prices downward with markets frequently increasing forward interest rate expectations. The Federal Funds rate has risen by 2.35%, the sharpest rapid increase for 40 years and is expected to rise by an additional 1.25% over the next six months. The US treasury 10-year bond yield has also more than doubled year to date. As interest rates have increased, the value of the shares of high growth tech companies have fallen by more than the value of shares of mature businesses, because more of the value of the growth tech companies is in the future.
Chart 4 – US Fed Fund Rate hike cycles Chart 5 – US 10 Year Treasury Bond Yield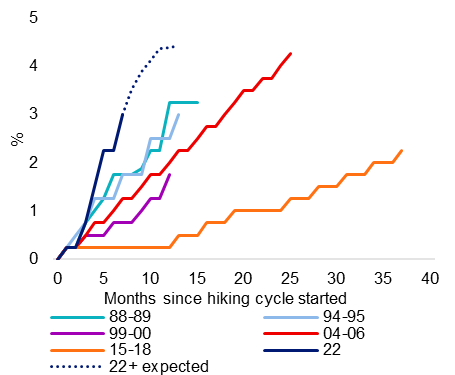
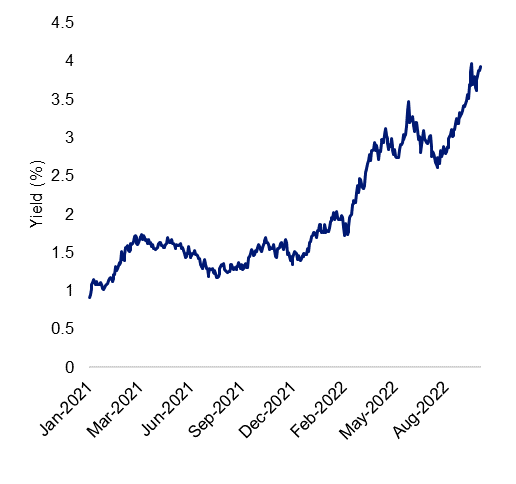
Source, Chart 4&5: Bloomberg
Chart 6 – 2022 Year to date performance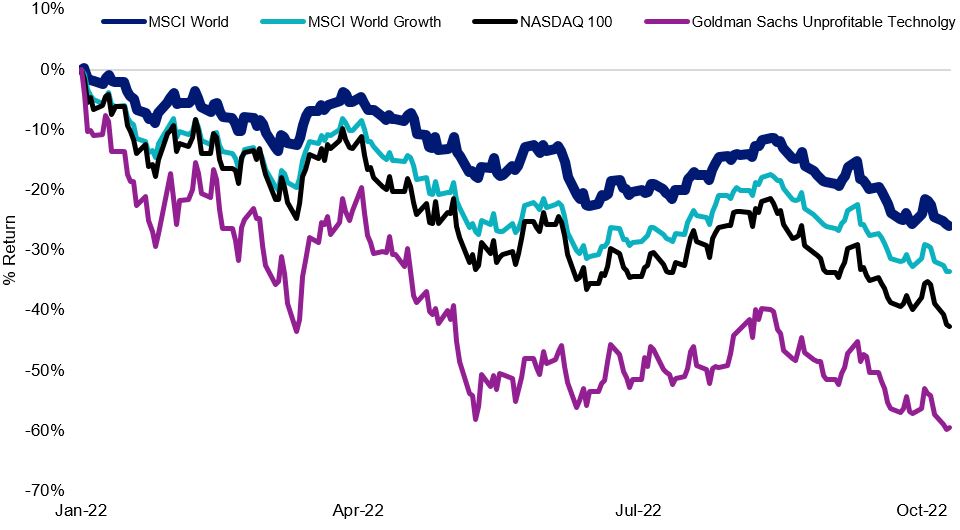
Source: Bloomberg, Past performance is not indicative of future performance.
What the dot com bubble taught us
The rapid rise and fall in equity valuations of the past few years echoes the 2001 dot com boom. Low interest rates in 1998 and 1999 facilitated an increase in start-up technology companies and investors eager to invest in the adoption of all things related to the internet. At the time investors overlooked traditional metrics, such as the price–earnings ratio, hoping these investments would turn substantial profits in the future. Start-up companies incurred net operating losses as they spent excessively on advertising to build brands and market share. However, it all unraveled as spending and earnings patterns couldn’t be sustained, resulting in significant falls in valuations. Looking back, MSCI World maximum drawdown was 46% over 31 months and 12-month trailing earnings per share dropped 43%.
Chart 7 – MSCI World Performance comparison Chart 8 – MSCI World 12m Trailing EPS change following dot com bubble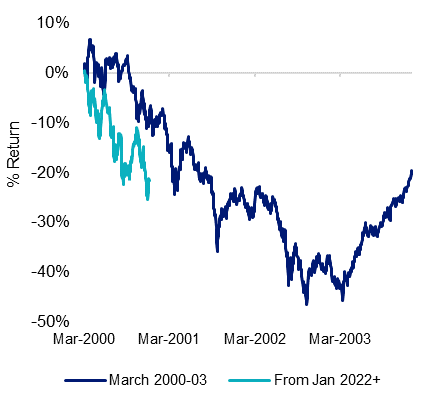
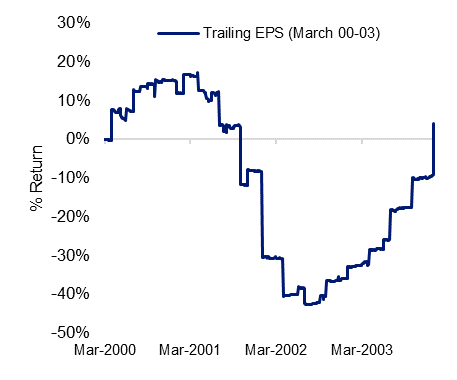
Source, Chart 7 & 8 : Bloomberg
It’s important to note that MSCI world valuations now are much lower than they were during the dot com bubble fallout and the consensus for earnings per share is expected to grow by 7% over the next 12 months, albeit much lower than this time 12 months ago.
Chart 9 - MSCI World price to earnings comparison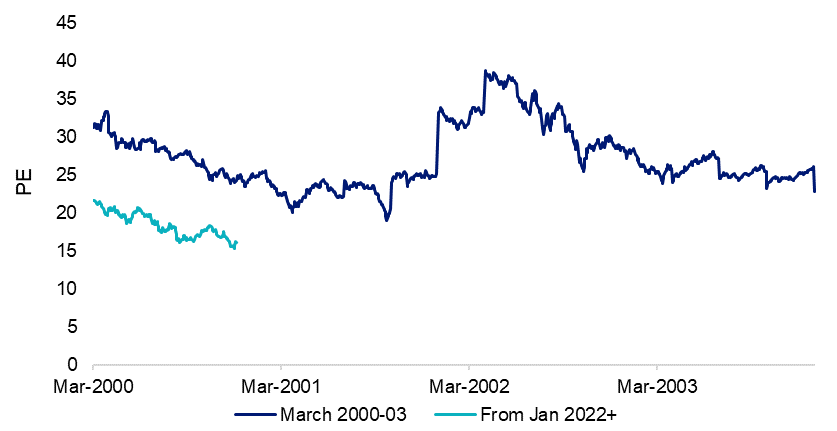
Source: Bloomberg
Finding value in an asset-deflation bear market
‘Value’ companies were the best performing following the dot com bubble, growth companies trading at very high valuations saw significant drawdowns relative to the market and the outcome was a compression in valuations between growth and value companies between 2000 and 2003. Currently, the dispersion between valuations in growth and value companies are at near all-time highs. We could see a similar scenario play out in the near-term as central banks continue to aggressively tighten policy rates.
Chart 10 - MSCI World factor performance following Chart 11 - Price to 12m Forward Earnings ratio:
dot com bubble MSCI World Value vs Growth 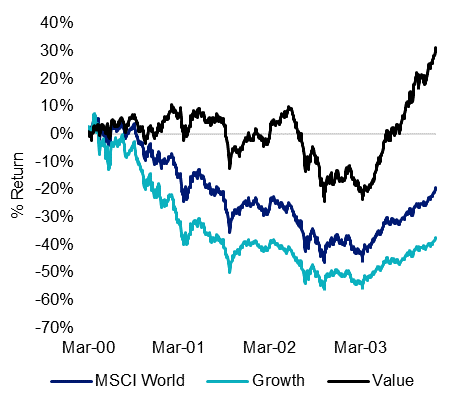
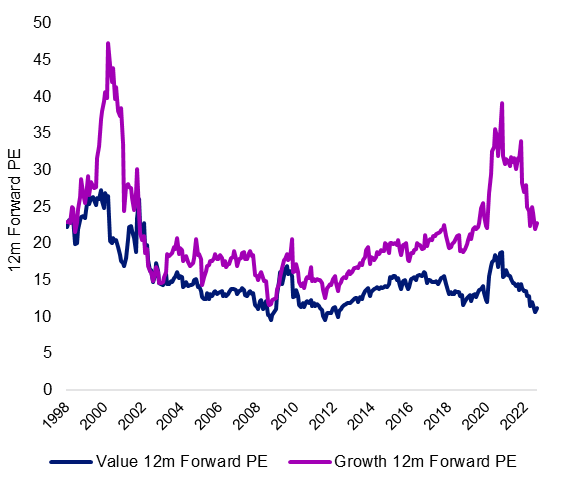
Source, Chart 10&11: Bloomberg
Chart 12 - Relative Price to Book ratio Chart 13 - Relative price to 12m Forward earnings ratio
MSCI World Value vs Growth MSCI World Value vs Growth 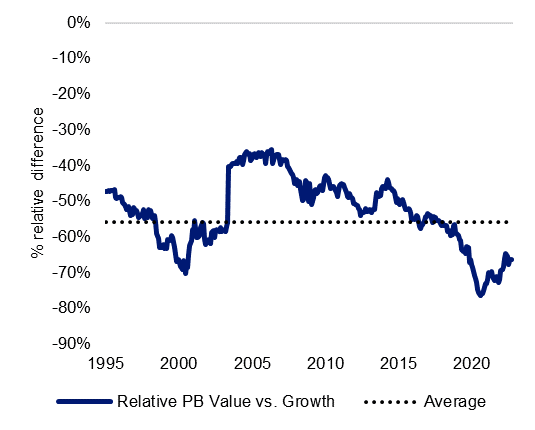
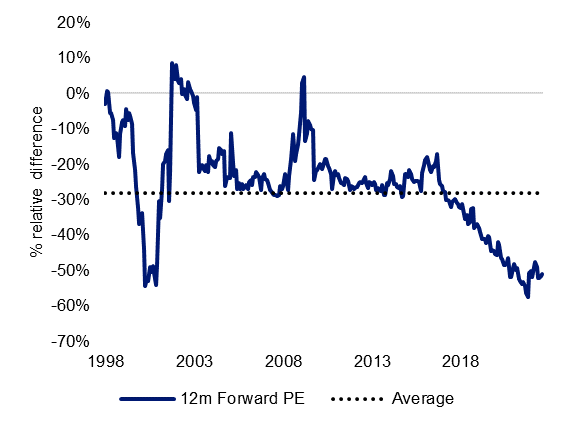
Source, Chart 12&13: Bloomberg
Access to value companies
Australian investors can now access entire portfolios of international securities selected on the basis of individual or multiple factors via a range of ETFs on ASX including the VanEck MSCI International Value ETF (ASX: VLUE). VLUE tracks MSCI World ex Australia Enhanced Value Top 250 Select Index.
MSCI’s Enhanced Value Index applies three valuation ratio descriptors on a sector relative basis:
- price-to-book value;
- price-to-forward earnings; and
- enterprise value-to-cash flow from operations.
Compared to a traditional value approach, MSCI’s enhanced value overcomes many of the criticisms of value because it puts less weight on price-to-book as a metric and moves away from backward-looking dividend yield altogether. It uses a whole-firm valuation measure in enterprise value that could reduce concentration in leveraged companies. It also employs a sector neutral approach that MSCI found mitigates some of the drawdown inherent with the value investing style.
Like all investments, there are risks associated with an investment in any of the ETFs we have mentioned. These include ASX trading time differences, financial markets generally, hedging (QHAL), individual company management, industry sectors, foreign currency, country or sector concentration, political, regulatory and tax risks, fund operations and tracking an index. See the PDS for details.


Published: 19 October 2022