Does the 2023 growth rotation have more legs?
The strength of equity markets year to date, notably ‘growth’ companies, has taken the market by surprise. The question for investors now is whether ‘growth’ can continue to outperform or if a ‘value’ rotation is on the horizon.
The rally of the US technology mega caps, those companies known as the ‘magnificent seven’ have accounted for more than 75% to S&P 500 returns YTD (21.75% as at 16 August 2023). Unprofitable/disruptor growth companies akin to many thematic exposures such as cryptocurrency have also recorded substantial share price gains.
The outcome has seen growth valuations jump back to levels shy of dotcom and COVID-19 bonanza multiple highs. The question for investors now is whether ‘growth’ can continue to outperform or if a ‘value’ rotation is on the horizon.
Growth versus value
The strength of equity markets year to date, notably ‘growth’ companies, has taken the market by surprise. The rally of the US technology mega caps, those companies known as the ‘magnificent seven’ have accounted for more than 75% to S&P 500 returns YTD (21.75% as at 16 August 2023). Unprofitable/disruptor growth companies akin to many thematic exposures such as cryptocurrency have also recorded substantial share price gains.
The outcome has seen growth valuations jump back to levels shy of dotcom and COVID-19 bonanza multiple highs. The question for investors now is whether ‘growth’ can continue to outperform or if a ‘value’ rotation is on the horizon.
MSCI World Growth has outperformed MSCI World Value so far in 2023. Catalysts for the outperformance have been twofold – falling inflation and better-than-expected earnings growth. MSCI defines growth companies as those that have delivered high sales and/or earnings growth. The index is overweight US technology mega caps and unprofitable disruptor companies.
Chart 1- Relative performance of value versus growth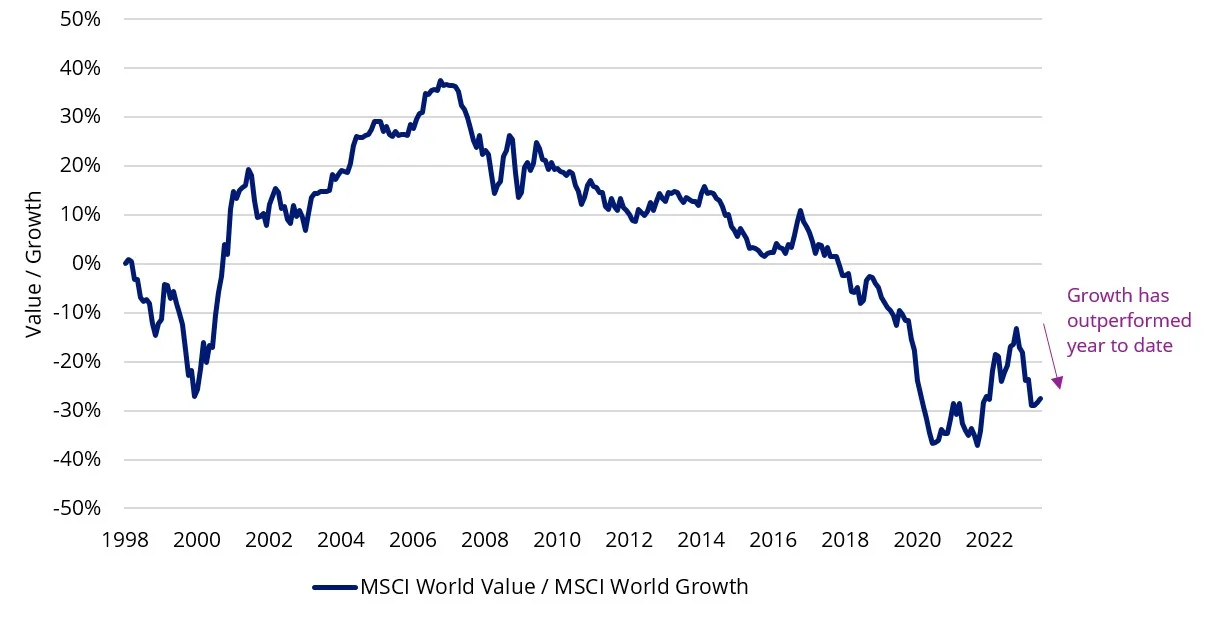
Source: Bloomberg
1. Falling inflationFalling energy and goods prices in the US have contributed to headline CPI returning to 3.2% from a peak of 9.1% in just 12 months. A disinflationary environment benefits growth companies as falling interest rates typically follow, reducing their cost of capital and improves the net present value of their expected future earnings, and subsequently stock prices.Does the 2023 growth rotation have more legs?
Chart 2- Contributions to US CPI YoY, energy prices are deflationary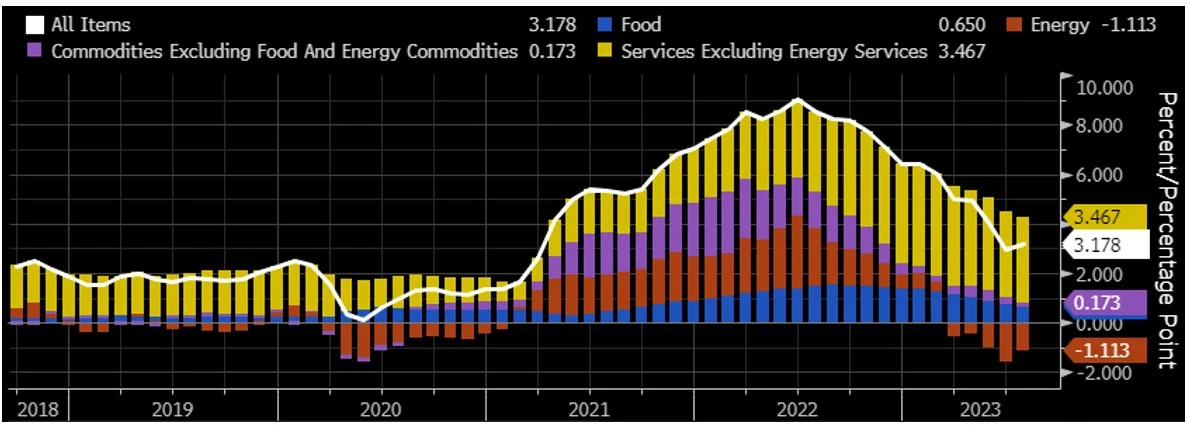
Source: Bloomberg, 31 July 2023
2. Earnings upside surprise
US earnings results came in better than expected for both Q1 and Q2 2023. Despite fears of an impending recession following the fastest rate hike cycle in a generation, US company earnings, notably US technology showed resilience, reporting a strong bounce back in earnings growth.
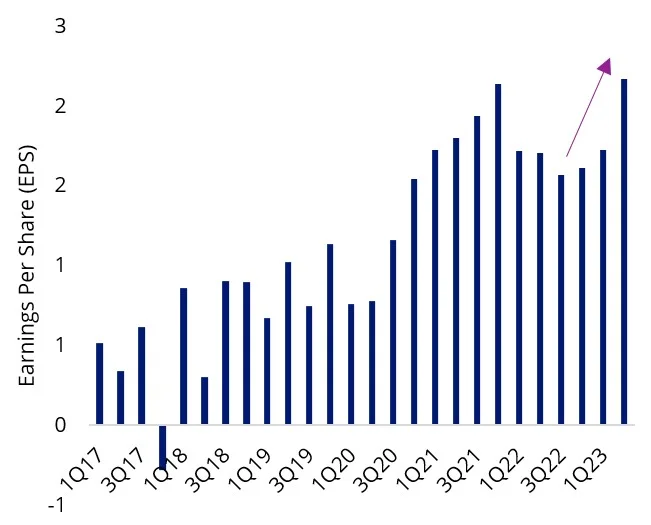
Google's parent company Alphabet, reported better-than-expected second-quarter revenue and profit, driven by growth in its cloud-computing unit. The company’s core advertising business returned to growth following two straight quarters of declines.
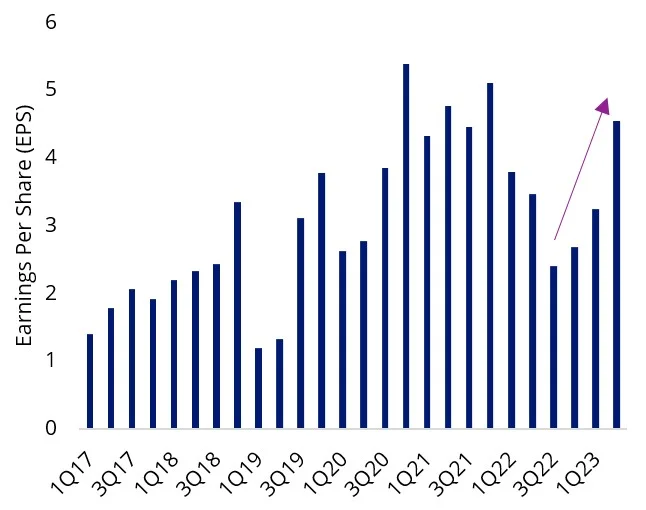
Facebook’s parent company Meta reported double-digit revenue growth for the first time since the fourth quarter of 2021 and issued better-than-expected guidance for the third quarter on the back of a rebound in the digital advertising market. The company has also reduced its capital spending plans for 2023 but spending is set to increase in 2024 as it expands its work on generative AI software.
| Chart 3: Meta earnings per share | Chart 4: Google earnings per share |
 |
 |
Valuations differential
These dynamics contributed to price gains outpacing earnings per share growth, resulting in growth valuation multiples reaching levels near the dot.com bubble and COVID-19 bonanza peaks. No investors are wondering if a higher valuation multiple is sustainable.
Chart 5: Valuations versus relative performance, 12m forward PE: Growth versus Value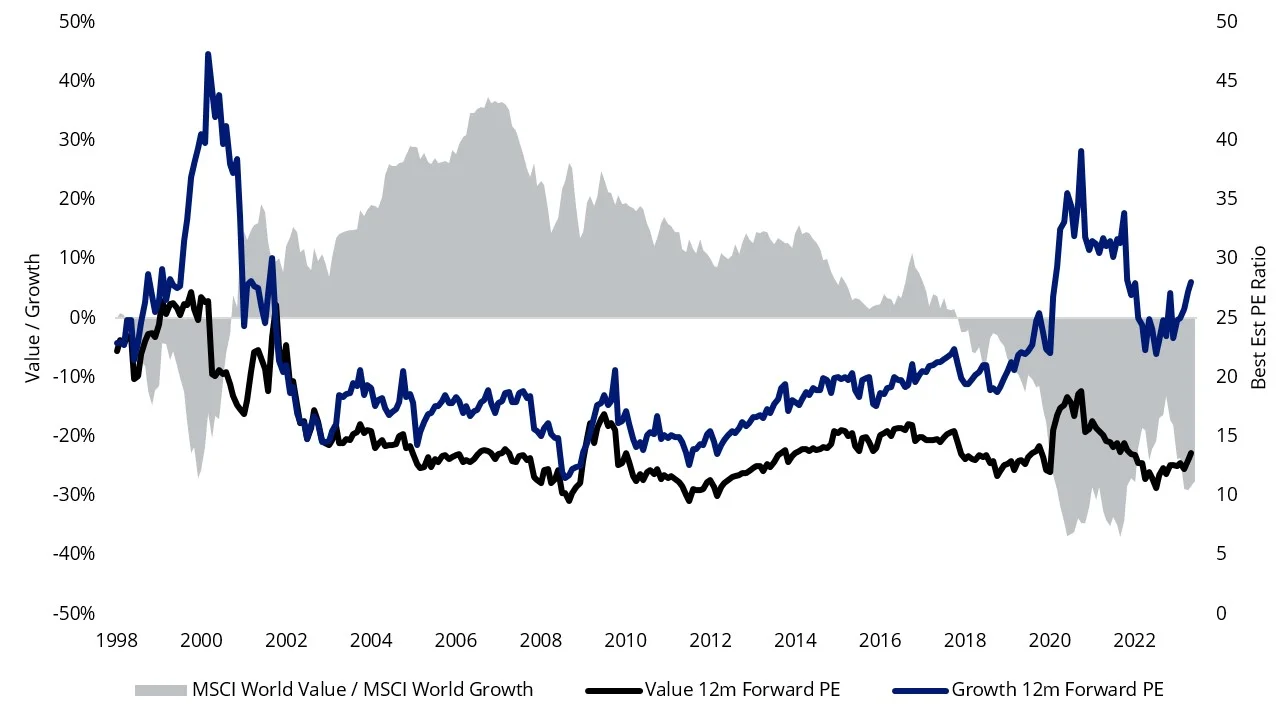
Source: MSCI
What economic weakness could mean for equity markets?
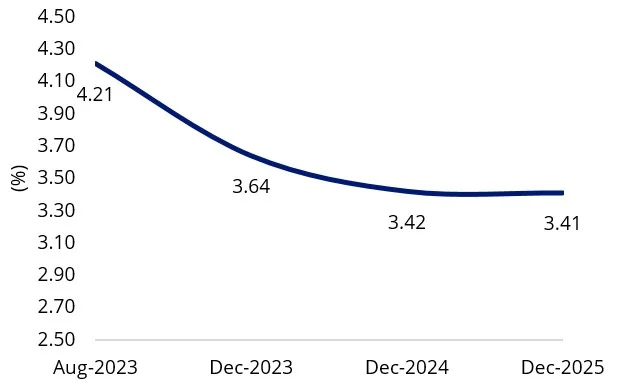
We could finally be at the point where we see a shift in the interest rate cycle. The lagged effect of the rapid tightening cycle is likely to hit hardest in 2024. The US 10-year government bonds yield is above 4 per cent, but could trend down when central banks shift guidance to hold or cut policy rates because of prolonged economic weakness. Market consensus is for the US 10-year yield and Fed Funds rate to fall over the next 2-3 years.
| Chart 6: US 10 Year Govt.Bond Yield consensus forecast | Chart 7: Fed Funds Rate Futures Curve |
 |
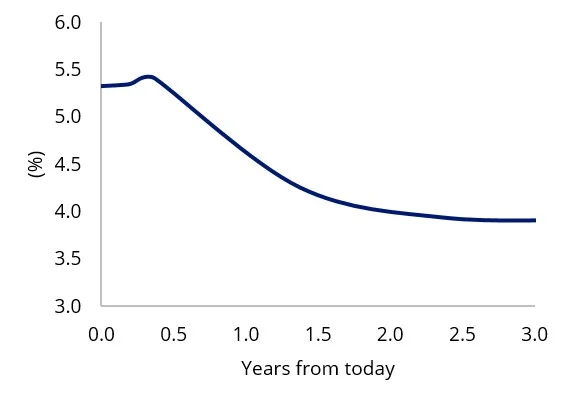 |
| Source: Bloomberg, As at 16 August 2023. | Source: Bloomberg, As at 16 August 2023. |
Should the global economy deteriorate, this could favour growth companies and asset classes with a high active return correlation to the ‘growth’ factor. Global weakness puts downward pressure on interest rates, providing a buffer on valuation compression of growth companies. Growth companies outperformed between Global Financial Crisis and COVID-19, a stagnant economic environment characterised by subdued inflation and slow economic activity.
Access to growth
VanEck offers a range of ETFs that capture the ‘growth’ complex. The chart below highlights the active correlation of MSCI World Growth against a range of VanEck equity ETFs.
Table 1: 8-year active return correlation to MSCI World Growth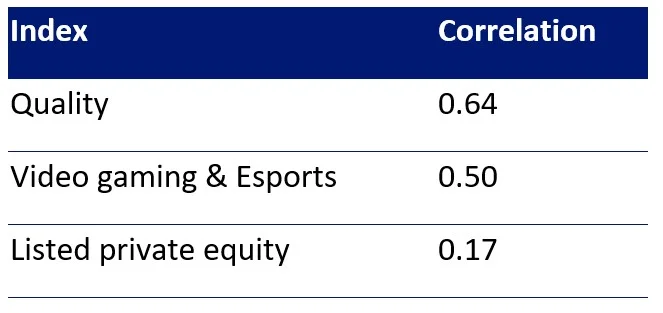
Source: Bloomberg, AUD terms. Quality as MSCI World ex Australia Quality Index, Video Gaming & eSports as MVIS Global Video Gaming and esports Index, Listed private equity as LPX50 Index, As at 31 July 2023.
Learn more about Quality investing
The quality factor is a defensive strategy designed to outperform in a late cycle environment. MSCI defines quality companies as those with: high return on equity (ROE), stable year-on-year earnings growth and low financial leverage. Applying a quality screen across global equities results in an overweight position to US technology mega caps as these businesses are established with a proven track record of delivering stable earnings growth.
VanEck offers three ETFs that invest in quality companies which track MSCI Quality indices: The VanEck MSCI International Quality ETF (ASX: QUAL), an Australian dollar hedged version of QUAL which has ASX code: QHAL, and the VanEck MSCI International Small Companies Quality ETF (ASX:QSML).
Learn more about VanEck Global Listed Private Equity ETF (ASX Ticker: GPEQ).
GPEQ gives investors a diversified portfolio of the 50 largest and most liquid global listed private equity companies. Listed private equity can provide investors with similar exposure to the benefits of unlisted investments in a more transparent, lower cost, and accessible way. Private equity firms target investments that offer significant upside potential.
Learn more about VanEck Video Gaming and Esports ETF (ASX Ticker: ESPO).
ESPO gives investors targeted exposure to companies that derive a significant portion of their revenues from the video gaming and esports industry, driving transformation in the sector.
Key Risks
All investments carry risks. We recommend you refer to the PDS and TMD for further details, and speak to a financial adviser.


Published: 18 August 2023
Any views expressed are opinions of the author at the time of writing and is not a recommendation to act.
VanEck Investments Limited (ACN 146 596 116 AFSL 416755) (VanEck) is the issuer and responsible entity of all VanEck exchange traded funds (Funds) listed on the ASX. This is general advice only and does not take into account any person’s financial objectives, situation or needs. The product disclosure statement (PDS) and the target market determination (TMD) for all Funds are available at vaneck.com.au. You should consider whether or not an investment in any Fund is appropriate for you. Investments in a Fund involve risks associated with financial markets. These risks vary depending on a Fund’s investment objective. Refer to the applicable PDS and TMD for more details on risks. Investment returns and capital are not guaranteed.