The reflation trade could be sustainable
We are potentially in a reflationary environment and markets have reacted. Investors are wondering if it is sustainable and how they should be positioned.
In recent weeks, ‘reflationary’ asset classes have had their time in the sun, evidenced by the relative outperformance of ‘value’ over ‘growth’ equities recently and the outperformance of small companies over large companies. This ‘reflation trade’ follows market participants now forecasting a ‘no landing’ scenario for the US economy this year. Catalysts for this include hot US inflation prints, strong labour and economic data releases and the resurgence in many commodity prices. Now investors are wondering if the reflation trade is sustainable and how they should be positioned.
Reflation is the prospect of economic growth accelerating back to the levels they were at in the past. This seems to be the case because despite the rapid hike in the Fed funds rate, US CPI remains stubborn, there has been an acceleration in manufacturing activity and the unemployment rate continues to sit near historic lows.
|
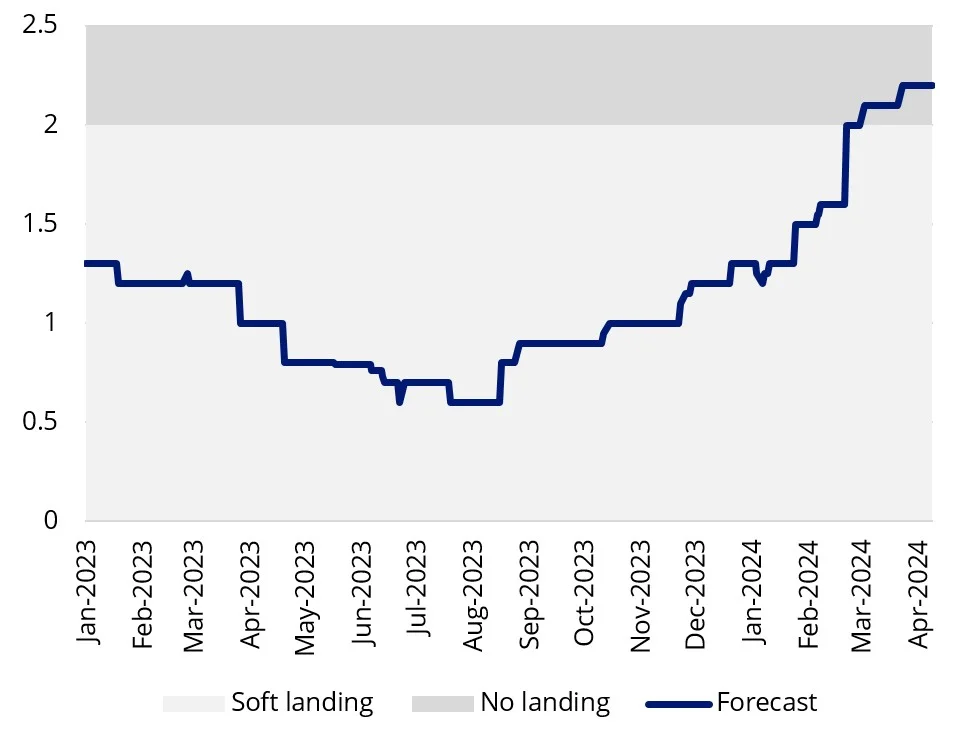
Chart 1: 2024 US Real GDP growth consensus forecast |
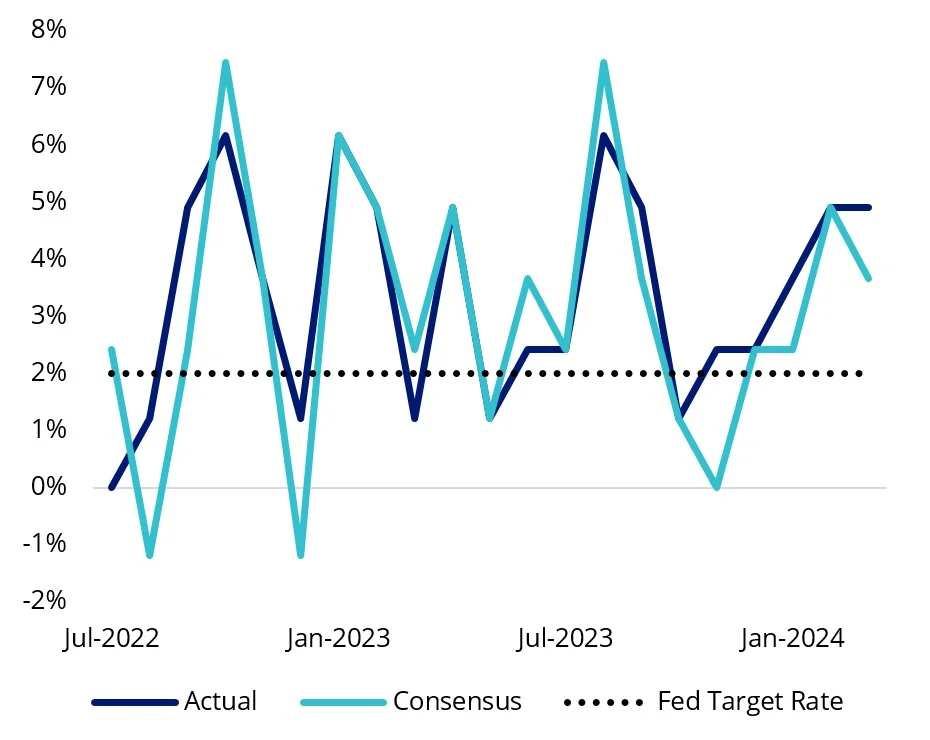
Chart 2: US CPI MoM annualised |
|
|
|
|
Source: Bloomberg, as at 15 April 2024. |
Source: Bloomberg, as at 15 April 2024. |
|
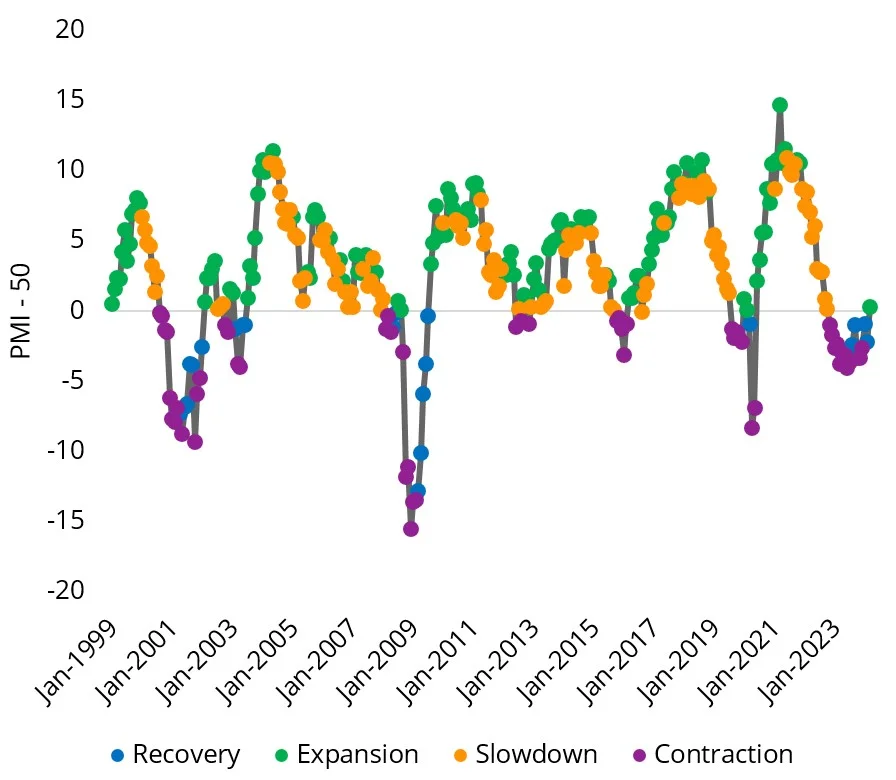
Chart 3: US manufacturing activity - Expansionary again (above 50) |
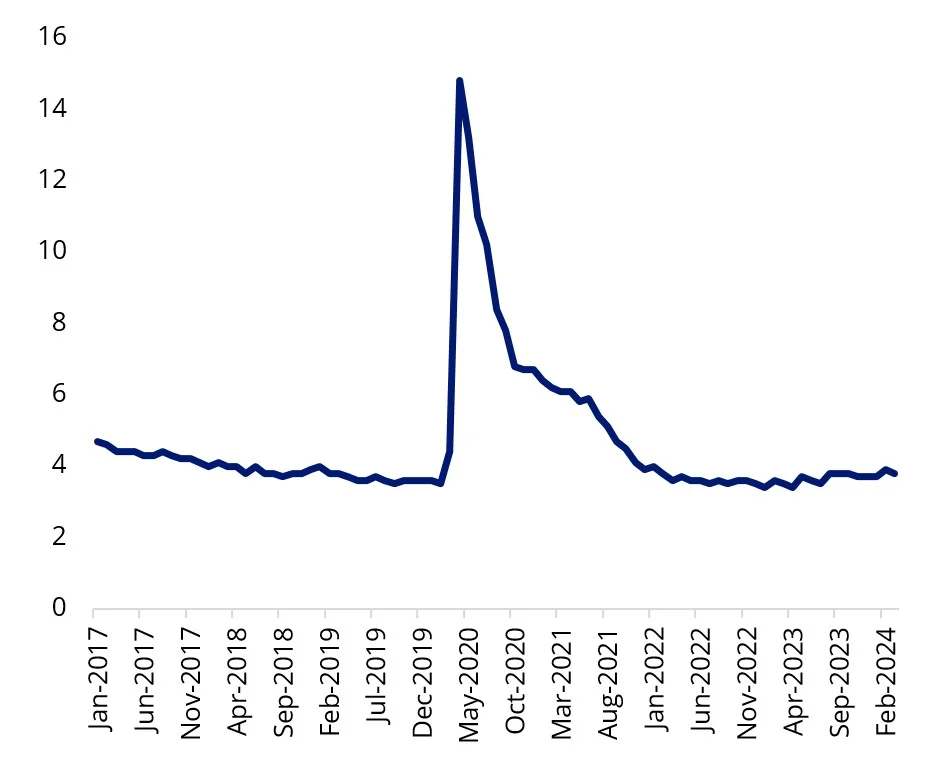
Chart 4: US unemployment rate |
|
|
|
|
Source: US ISM Manufacturing Index, Bloomberg, as at 15 April 2024. |
Source: Bloomberg, as at 15 April 2024. |
Data points reinforce the strength of the US economy and this is ultimately positive for equity markets. Earnings growth normally follows stronger economic growth with reflationary asset classes being the greatest beneficiaries. The challenge is that these asset classes have been out of favour for the past few years and could be the new stars, warranting a portfolio rethink. Reflationary asset classes include;
- Cyclical sectors such as industrials, consumer discretionary, real estate and resources; performance sensitive to changes in economic conditions.
- Commodities; prices linked to economic activity.
- Value companies; less sensitive to interest rate changes as companies trade at lower valuations relative to peers.
- Smaller companies; offer more upside potential through market share expansion.
- Australian dollar; risk on currency due to high resources exposure. Currency hedged exposure is preferred so as to mitigate the impact of foreign currency depreciation relative to AUD.
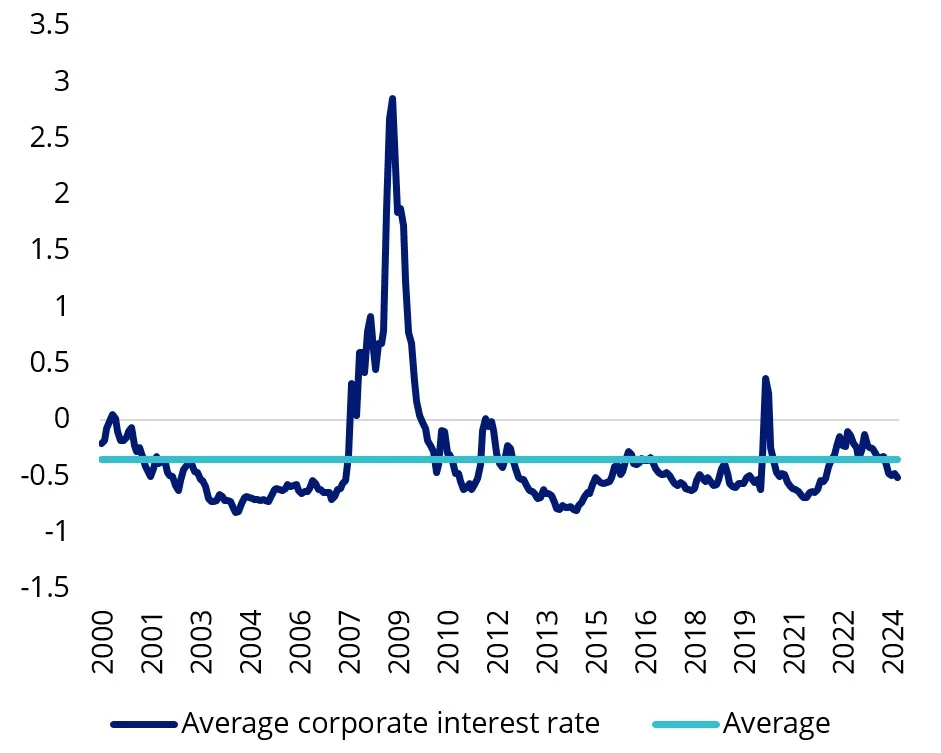
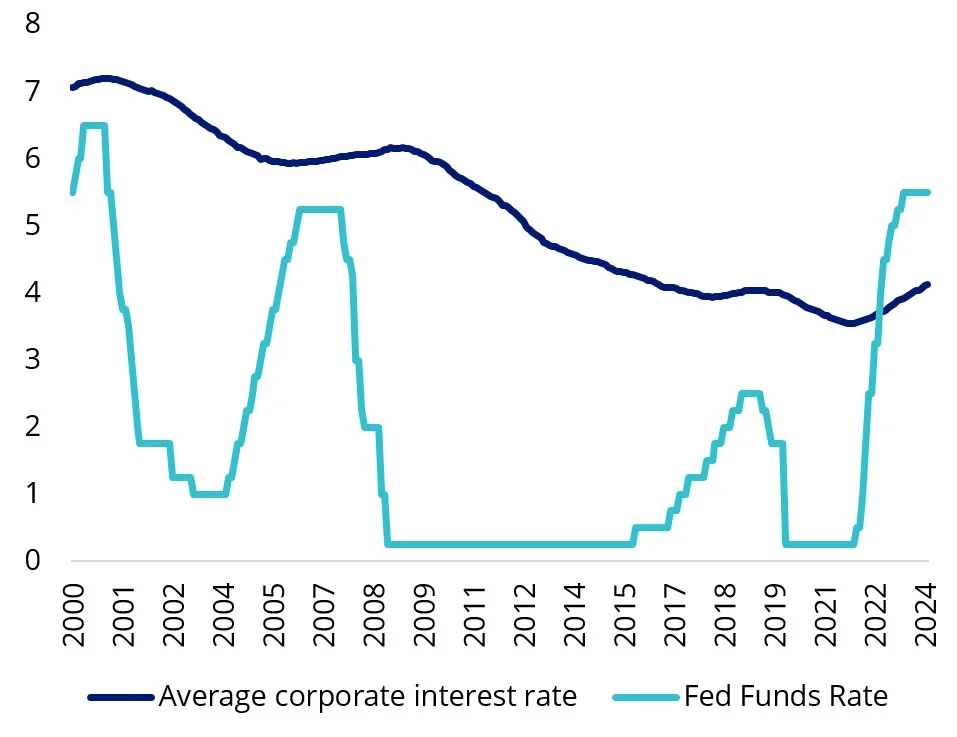
There are a few reasons, we think the reflation trade is sustainable. Financial conditions are loose, the corporate debt effective interest rates are materially lower than the Fed Funds Rate and a migration surge supports consumer demand. The US population grew 1.2% year on year, the highest since 2005.
|
Chart 5: Chicago Fed Financial Conditions Index - Loose (below average) |
Chart 6: Corporate interest versus Fed Funds Rate |
|
|
|
|
Source: Federal Reserve Economic Data, 31 March 2024 |
Source: Federal Reserve Economic Data, 31 March 2024 |
While many of the reflationary asset classes listed above have been out of favour with investors recently, there have been periods in the past when they were consistently the strongest performers. The best example is perhaps between the dot com bubble and global financial crisis. This was an era of high growth and high inflation. Average US CPI was 2.9 percent, sustainably above US Federal Reserve inflation target of 2 percent. US 10-year government bond yields steadily increased over this period, reflective of strong economic growth. During that period ‘value’ flourished, small companies outperformed, the Australian dollar appreciated, cyclicals did well and commodities rose.
In terms of phases of the economic cycle, reflationary asset classes historically outperform in an ‘expansion’. US ISM manufacturing index (PMI) which is a good proxy for economic activity highlights that we could be at the start of an ‘expansion’ phase. The PMI recently printed above 50 for the first time since 2021. The PMI measures the change in production levels across the US economy from month to month. The graph below highlights those small caps, REITs, Australian equities and currency hedged equities outperformed unhedged global equities in this environment.
Chart 7: US manufacturing activity - Expansionary again (above 50)
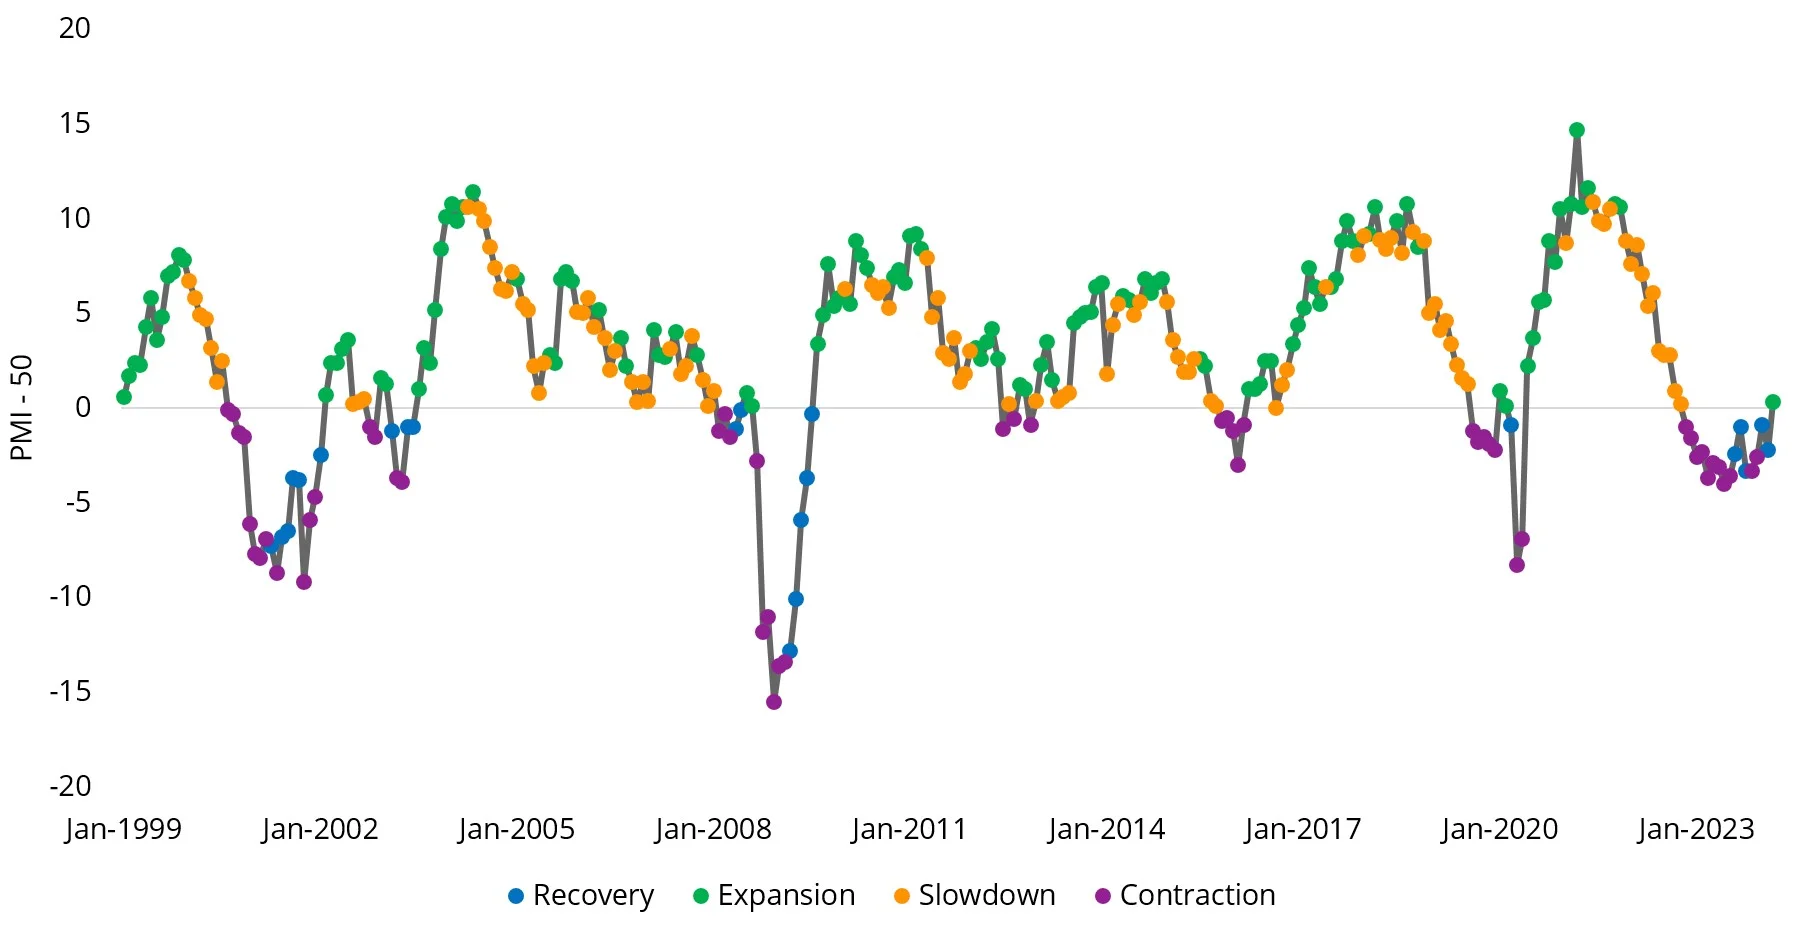
Chart 8: Performance during reflation environments
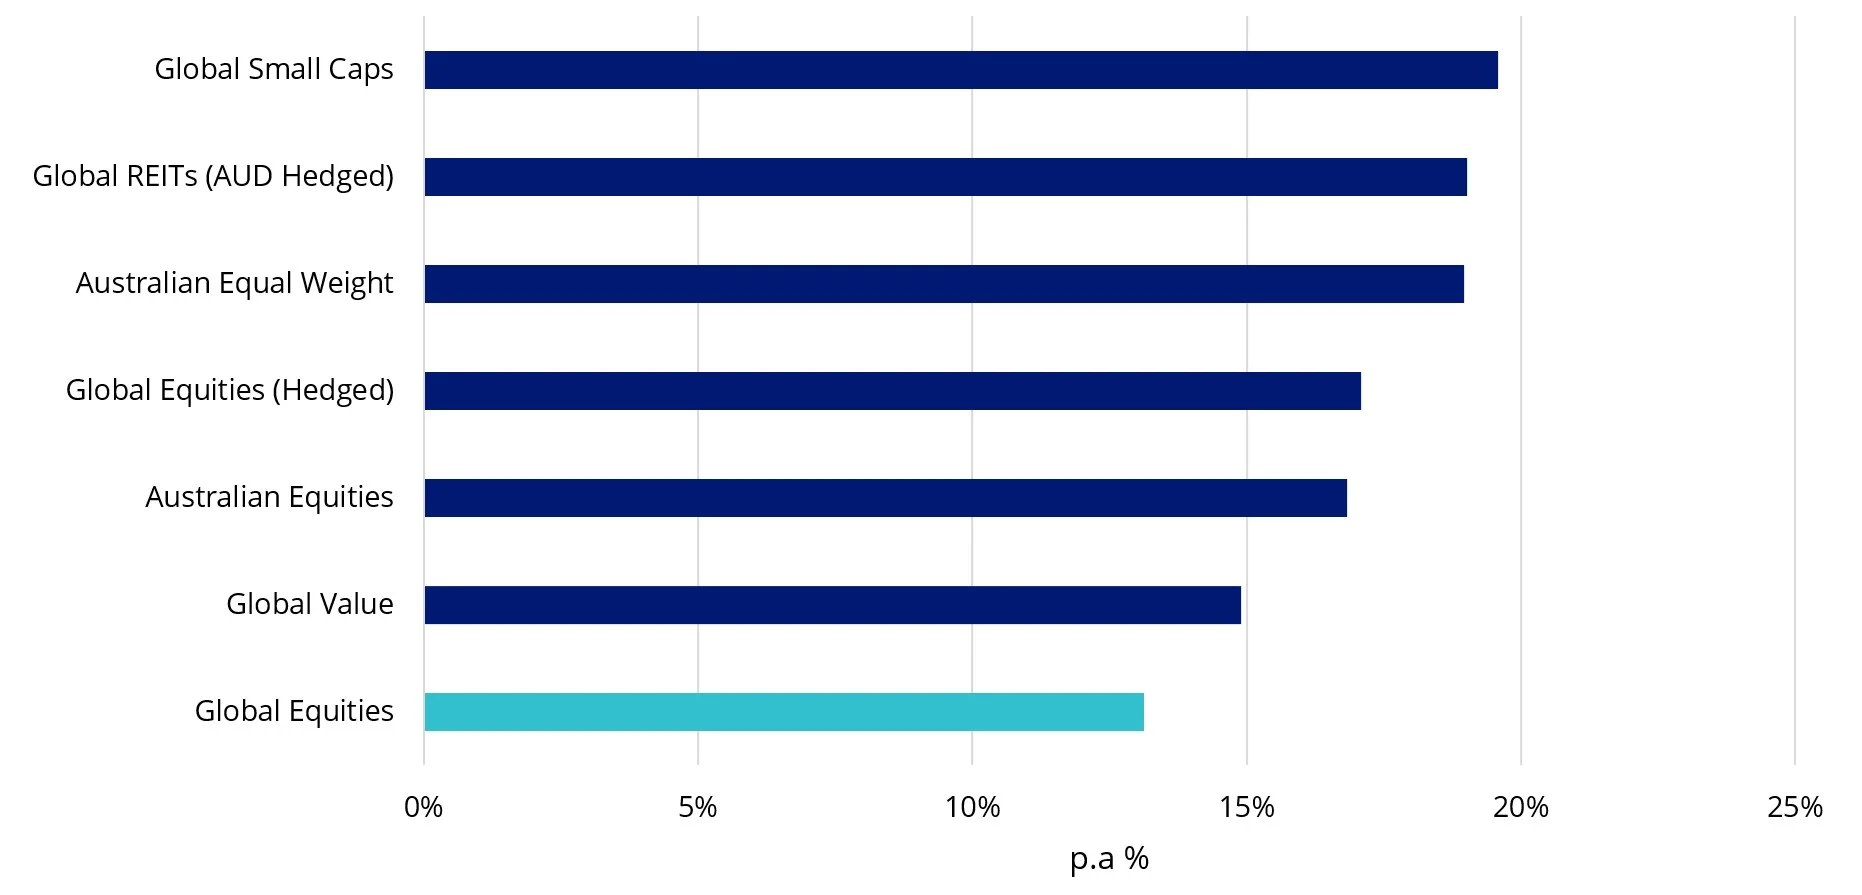
Source chart 7 & 8: ISM, Global REITs (AUD Hedged) as FTSE EPRA NAREIT Developed All REIT Index, Global Equities (AUD Hedged) as MSCI World ex Australia AUD Hedged Index. Australian Equities as S&P/ASX 200. Global Value as MSCI World Enhanced Value Index. Global Small Caps as MSCI World ex Australia Small Cap Index. 1 January 2001 to 31 March 2024. Economic phase is a function on the current value of PMI-50 and the three-month change in PMI.
Focusing on global small caps, valuations are attractive, so any momentum could continue. Global small cap valuations relative to large caps are near 25-year lows. Global small cap valuation z-score is also below its historical average. If we do see a prolonged market recovery, small caps typically outperform large caps.
Chart 9: Global small less large cap valuation z-score
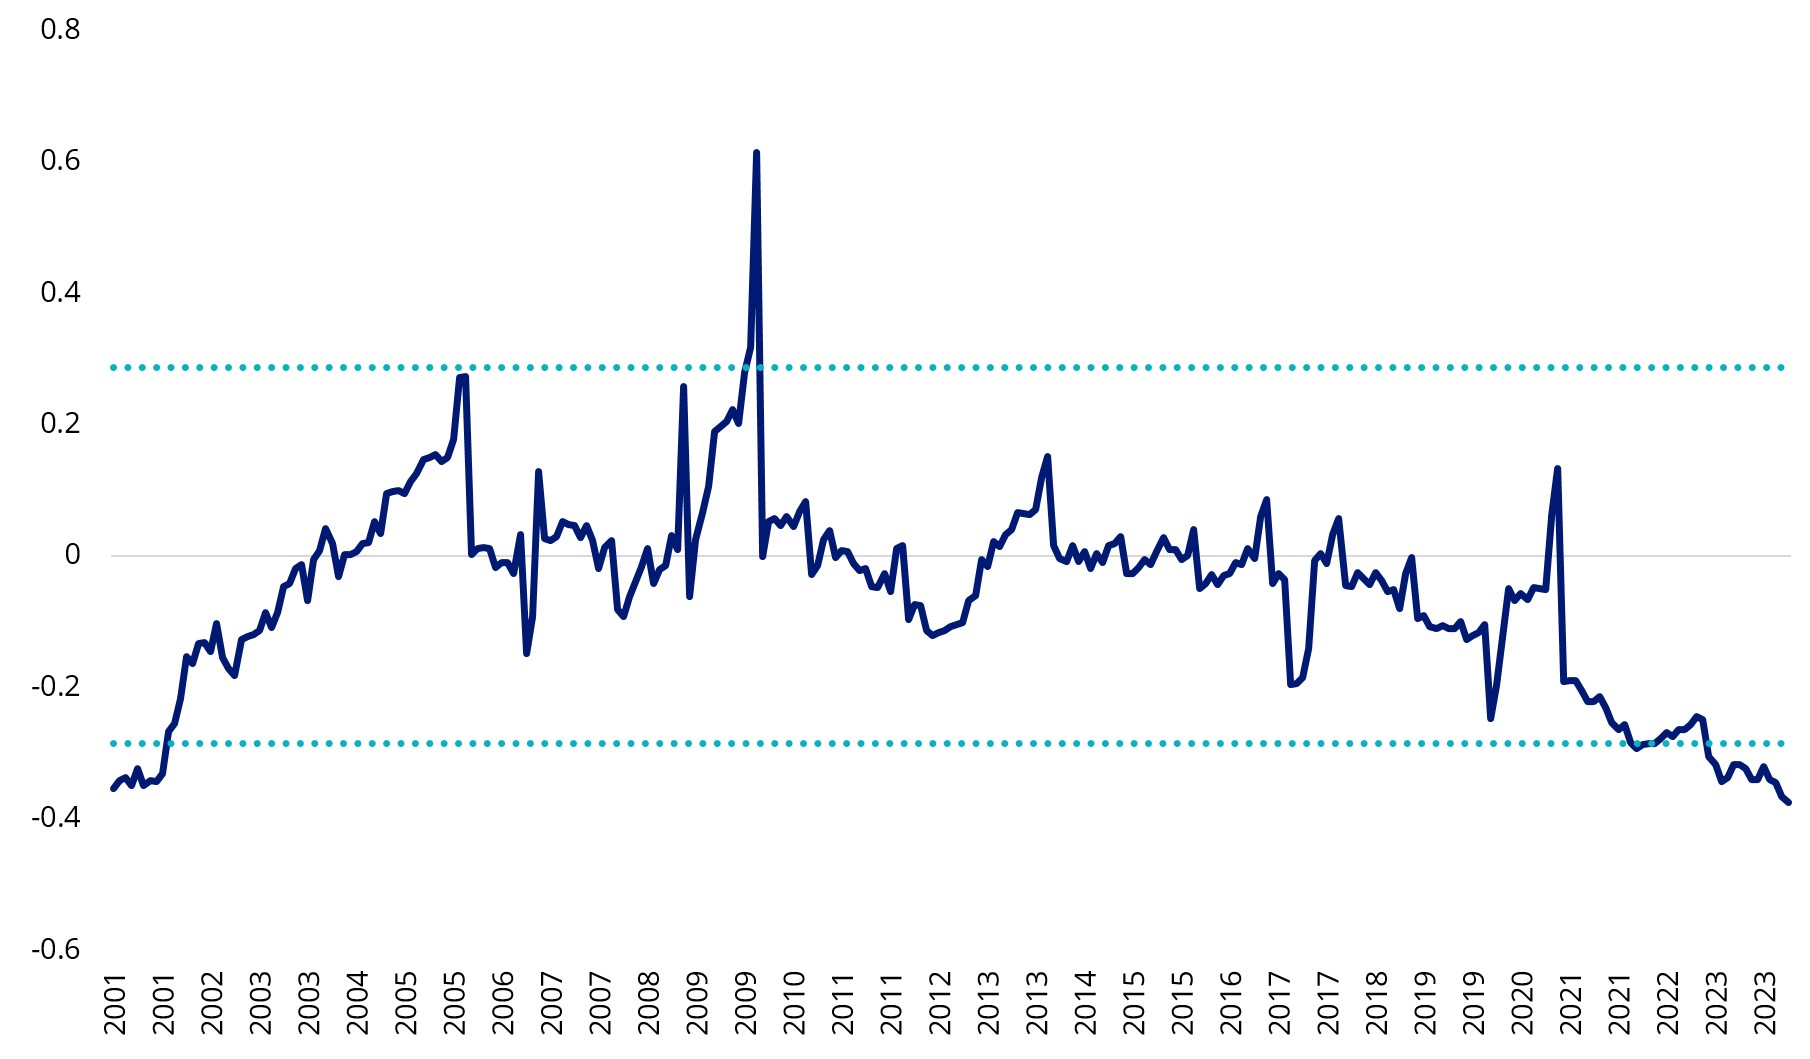
Source: Bloomberg, as at 31 March 2024. z-score (12m forward PE, 12m forward PB, 12m forward PS, CAPE).
Chart 10: Performance during market recoveries
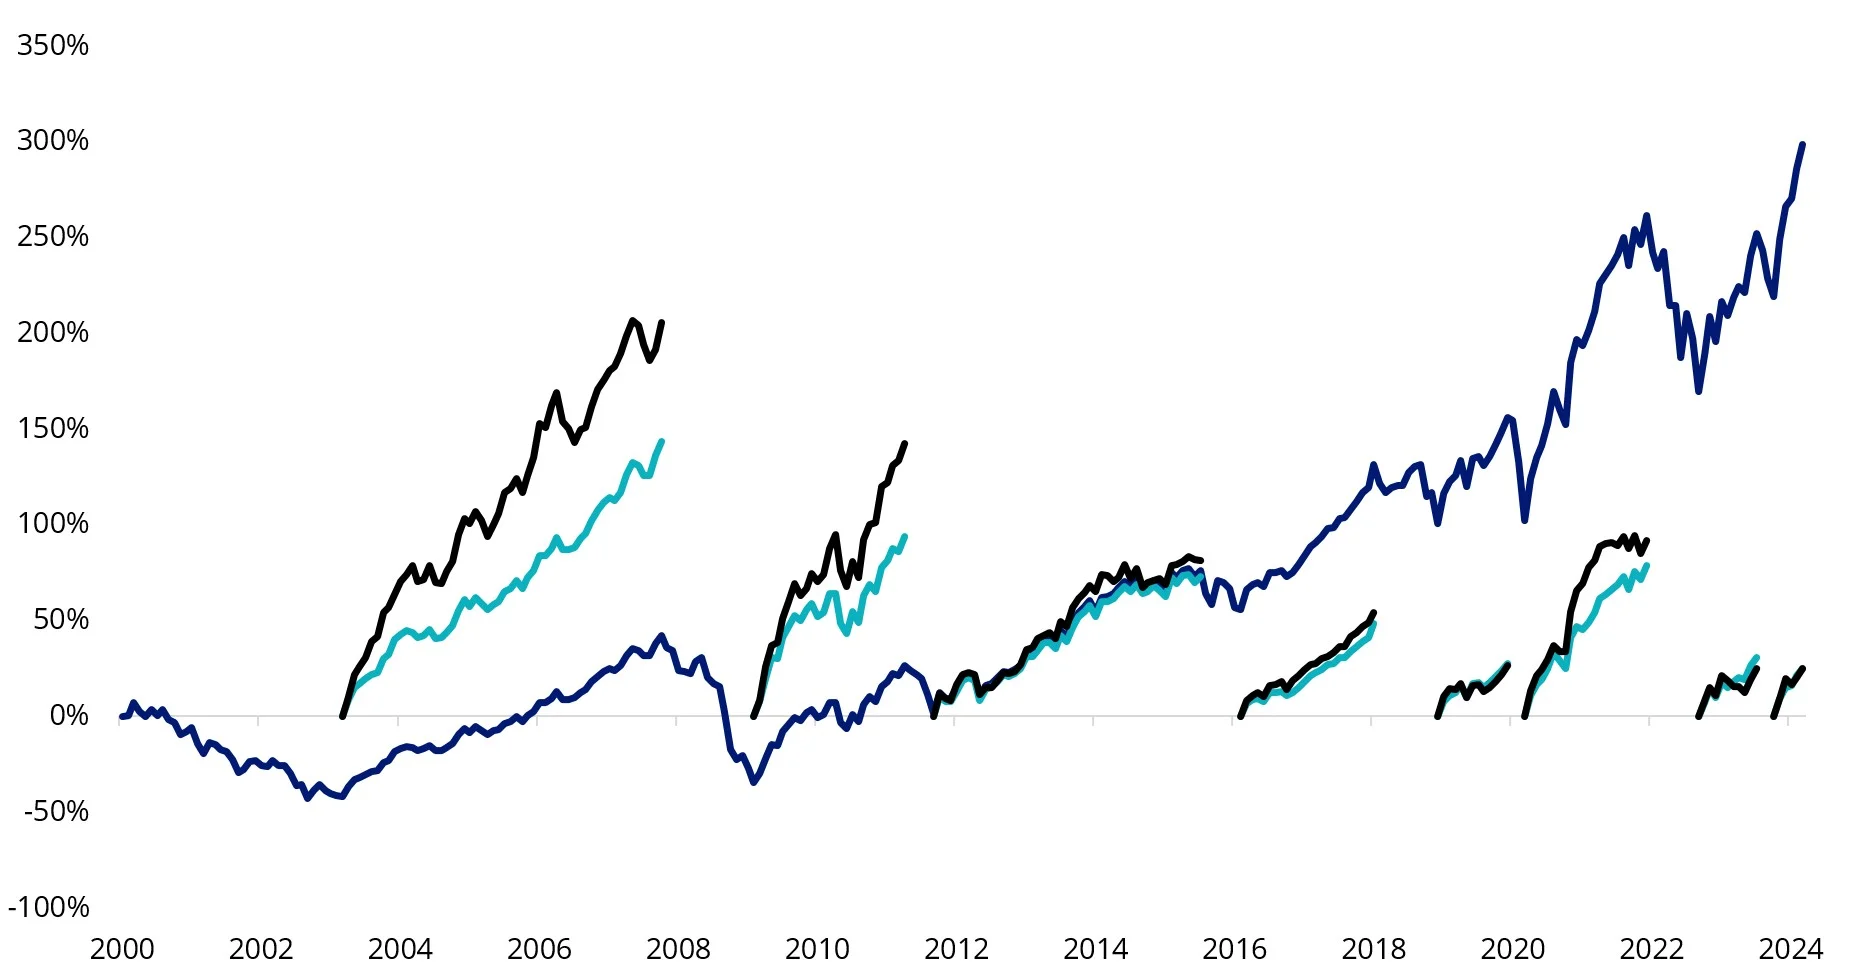
Source: Bloomberg, as at 31 March 2024. You cannot invest in an index. Past performance is not indicative of future performance.
Within global small caps, it pays to be selective. Quality small companies have shone over the last year, including the ones in our VanEck MSCI International Small Companies Quality ETF (ASX: QSML).
These are small companies that satisfy the “quality” requirements of exhibition high return on equity, earnings stability, and low financial leverage. Companies in the fund include leading audio tech company Dolby Labs (NYSE: DLB), famous for creating surround sound in cinemas worldwide, British board game company, Games Workshop (LON: GAW), which is famed for the Warhammer series, and First Financial Bank (NASDAQ: FFBC), a leading financial institution based in Texas.
Key risks
An investment in QSML carries risks associated with: ASX trading time differences, financial markets generally, individual company management, industry sectors, foreign currency, country or sector concentration, political, regulatory and tax risks, fund operations, liquidity and tracking an index. See the PDS for details.


Published: 26 April 2024
Any views expressed are opinions of the author at the time of writing and is not a recommendation to act.
VanEck Investments Limited (ACN 146 596 116 AFSL 416755) (VanEck) is the issuer and responsible entity of all VanEck exchange traded funds (Funds) trading on the ASX. This is general advice only and does not take into account any person’s financial objectives, situation or needs. The product disclosure statement (PDS) and the target market determination (TMD) for all Funds are available at vaneck.com.au. You should consider whether or not an investment in any Fund is appropriate for you. Investments in a Fund involve risks associated with financial markets. These risks vary depending on a Fund’s investment objective. Refer to the applicable PDS and TMD for more details on risks. Investment returns and capital are not guaranteed.