What is a sustainable moat and why is it important?
Economic moats protect a business, providing them an advantage over their competitors. The term was popularised by Warren Buffet with the rationale that businesses with sustainable competitive advantages or ‘moats’ will be more profitable in the long run than their peers. This in turn adds greater shareholder value for investors. A ‘moat’ refers to the water filled ditch that surrounds a medieval castle in order to fortify the castle against external threats. In the same way a castle needs to be fortified to fend off threats, businesses need to have attributes that protect them when new incumbents, competitors and economic environments disrupt or perturb them. The wider the moat, the more sustainable the business and the more value it can continue to deliver to shareholders.
Building on Buffett’s moat analogy, Morningstar has taken the economic moat concept a step further and developed a comprehensive moat-based analytic framework. A company may have great management, size, market share, technology, efficiencies or superior products but what Morningstar identifies is whether the company has a structural advantage that can sustain the high returns over a long period in the future. Morningstar has identified five potential sources of an economic moat: network effect; intangible assets; cost advantage; switching costs; and efficient scale. Each company with a moat rating has at least one of these moats.
Chart 1: Identifying quality: 5 sources of moats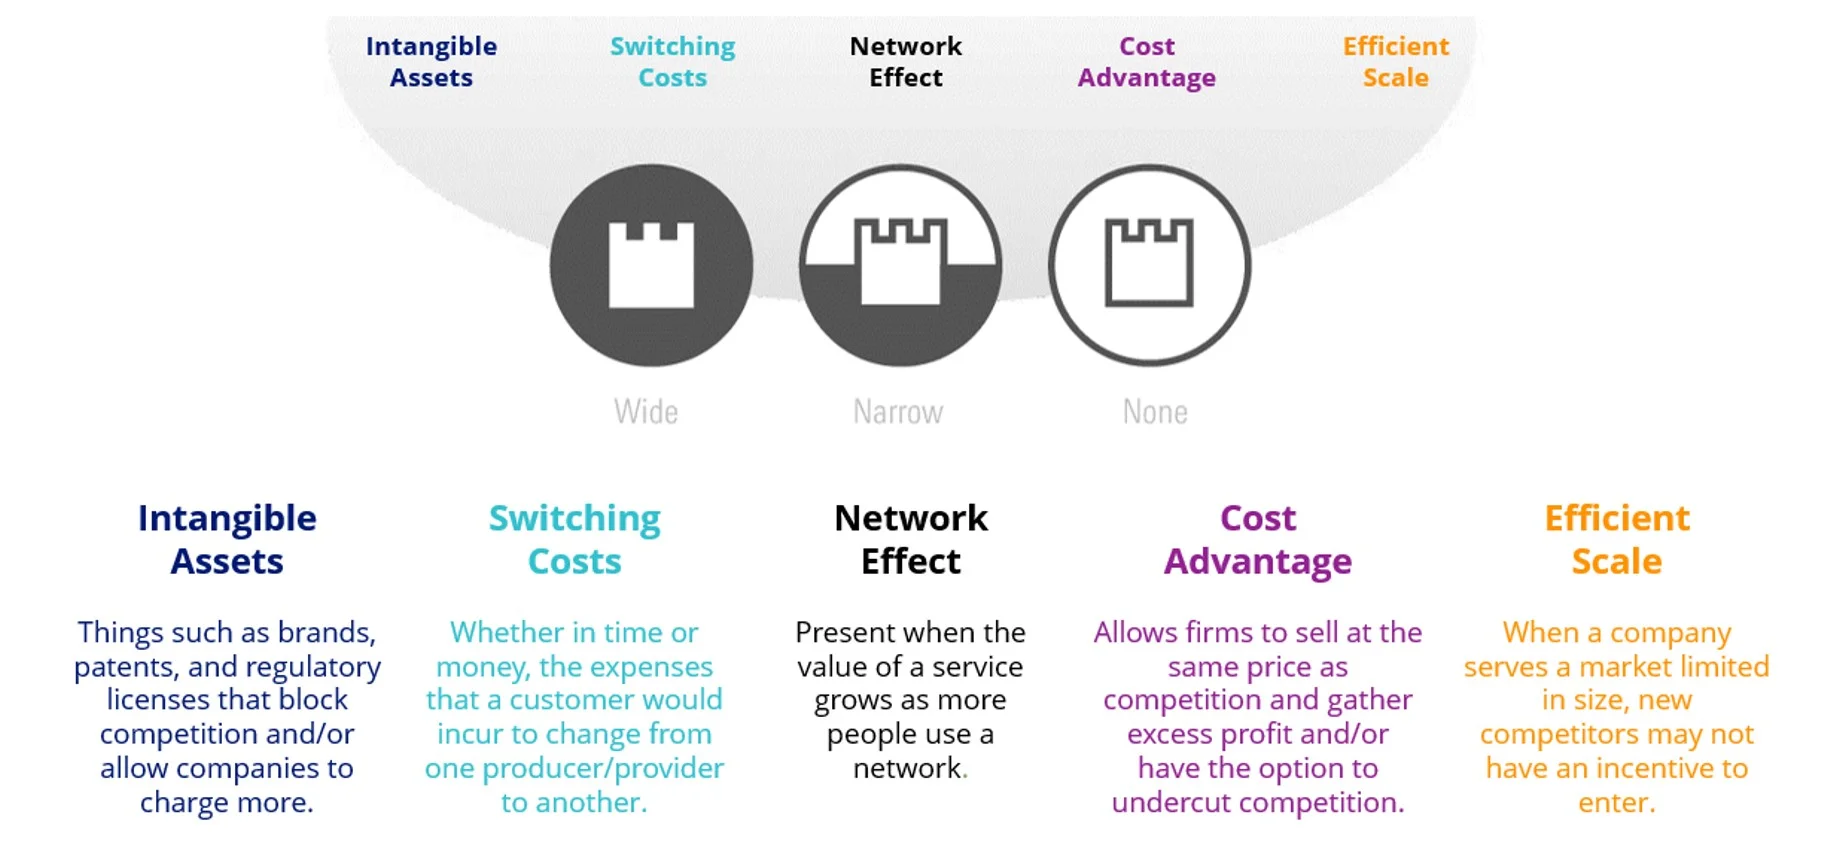
Source: Morningstar
VanEck Morningstar International Wide Moat ETF (GOAT) and VanEck Morningstar Wide Moat ETF (MOAT) gives investors who ascribe to the wide moat tenet access to a portfolio of diversified stocks with one transaction on the ASX. When constructing the index, Morningstar assigns each company it analyses an Economic Moat Rating of ‘wide’, ‘narrow’ or ’none’. Wide moat ratings are assigned to those companies in which Morningstar has very high confidence that excess returns will remain for 10 years, with excess returns more likely than not to remain for at least 20 years. Companies with a narrow moat rating are those Morningstar believes are more likely than not to achieve normalized excess returns for at least the next 10 years. A firm with either no sustainable competitive advantage or one that Morningstar thinks will quickly dissipate is assigned a moat rating of ‘none’.
Morningstar’s equity analysts also assign a fair value to each company in its coverage universe. Fair value is a per-share measure of what the business is worth. A three-stage discounted cash flow model is combined with a variety of supplementary fundamental methods such as sum-of-the-parts, multiples and yields in order to triangulate a company's worth.
Using a combination of the qualitative moat data and the quantitative fair value data, Morningstar constructs its Moat Index series. MOAT has a value tilt as Morningstar targets companies trading below its estimate of the fair value when it constructs its Wide Moat Index. The fund also has a quality tilt as companies in the fund generally have low financial leverage, consistent earnings and strong return on equity that they derive from the sustainable moat they’ve built in the business.
Chart 2: Holdings-Based Style Map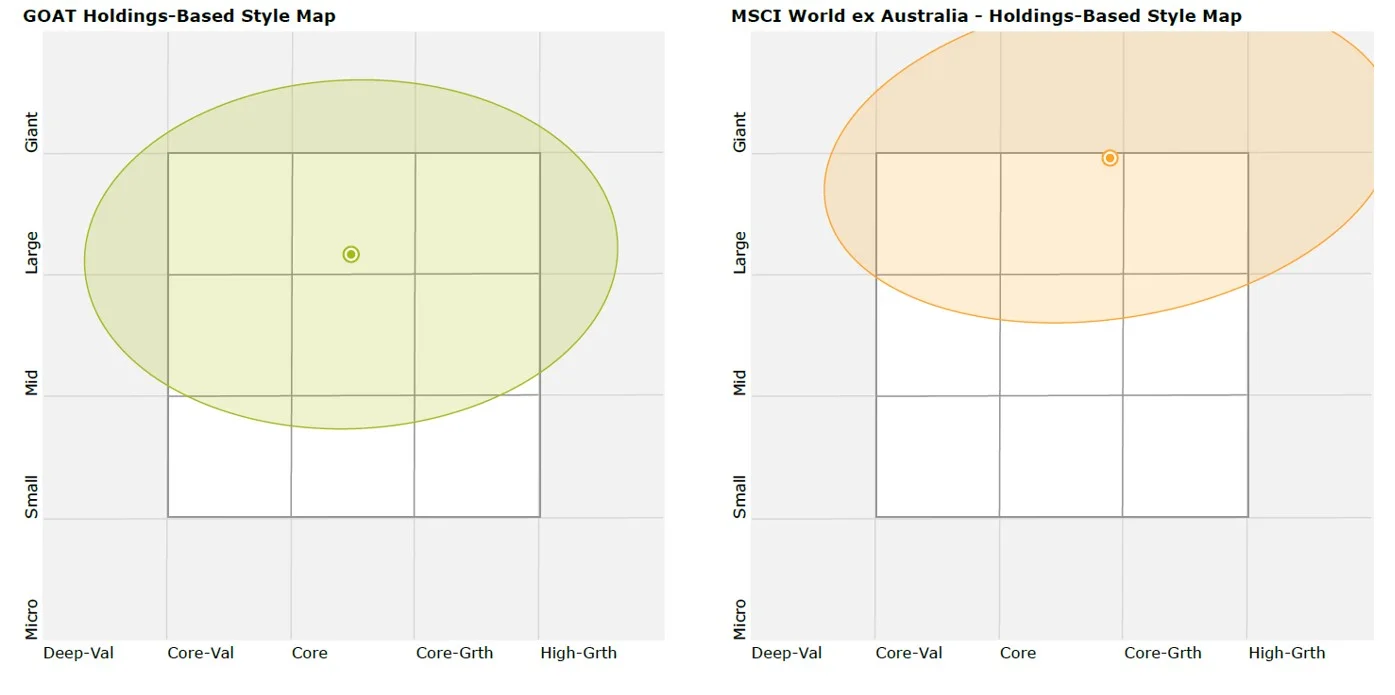
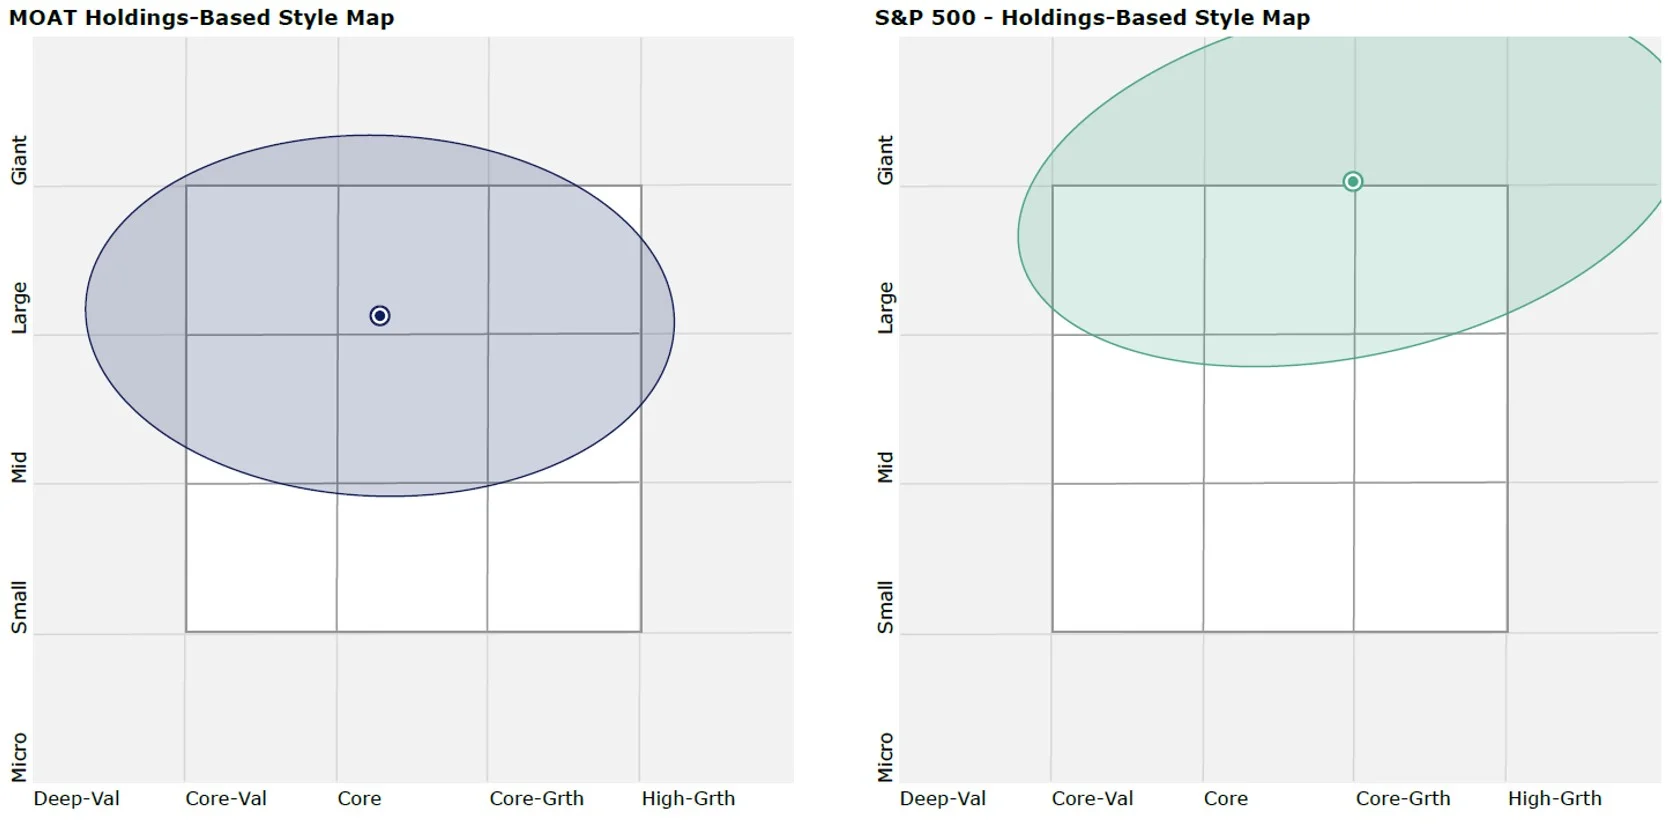
Source: Morningstar, 31 October 2023
In our view, Morningstar’s moat investment philosophy represents a more practical approach to identifying high quality companies. The economic moat framework considers quantitative inputs—such as returns on invested capital and costs of capital—to determine the staying power of a company’s competitive advantages, but it also relies on forward-looking qualitative assessments by analysts. The current economic environment is conducive to moat investing as value and quality companies that are not as prone as the rest of the market to economic gyrations can better tolerate the tumultuous environment.
Chart 3: Fundamentals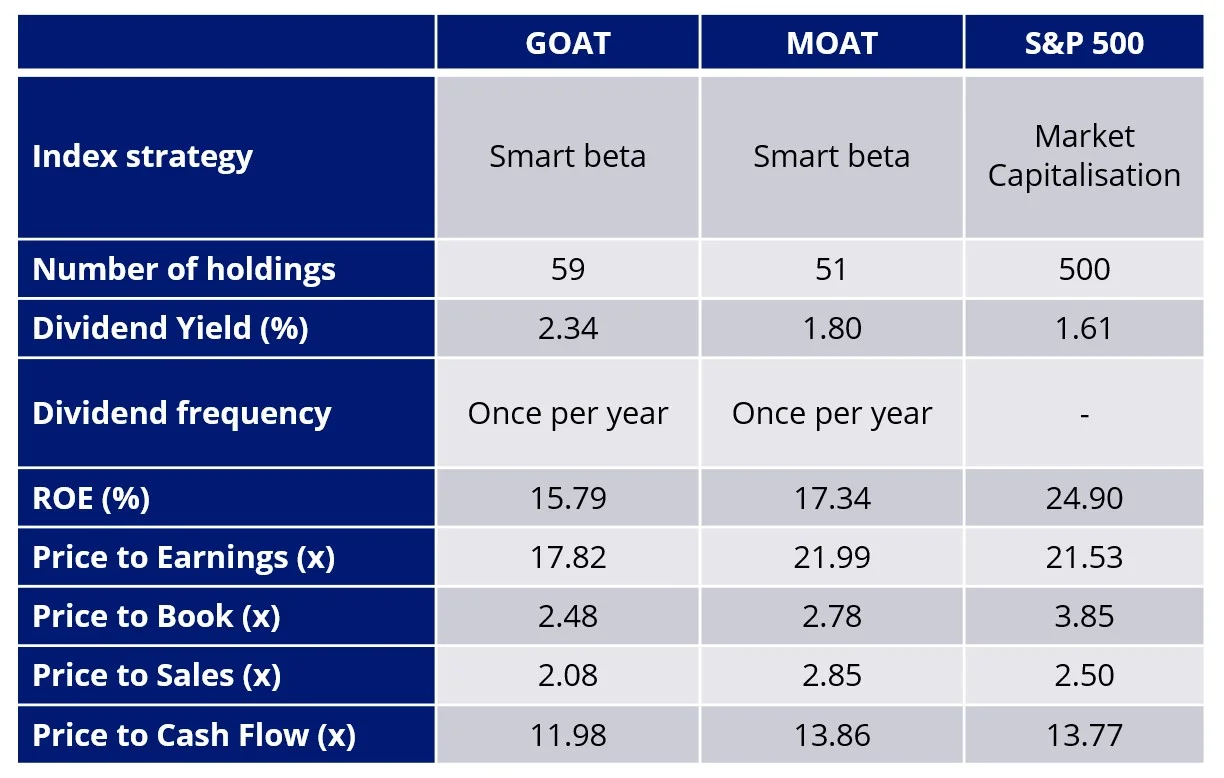
Source: Factset, 31 October 2023. Past performance is not indicative of future performance. You cannot invest in an index.
Markets have been processing mixed results this year; generally strong earnings and policy action on distressed US banks have abated investors’ concerns of contagion risk. Meanwhile enduring higher rates combined with sustained low unemployment and high inflation has fostered a low growth and higher for longer environment. These factors have elevated the probability of recessions across countries. The flare up in conflict in the Middle East is the most recent event to jolt markets, creating potential pockets of inflated price bubbles such as oil.
Chart 4: Key recession indicator - Yield curve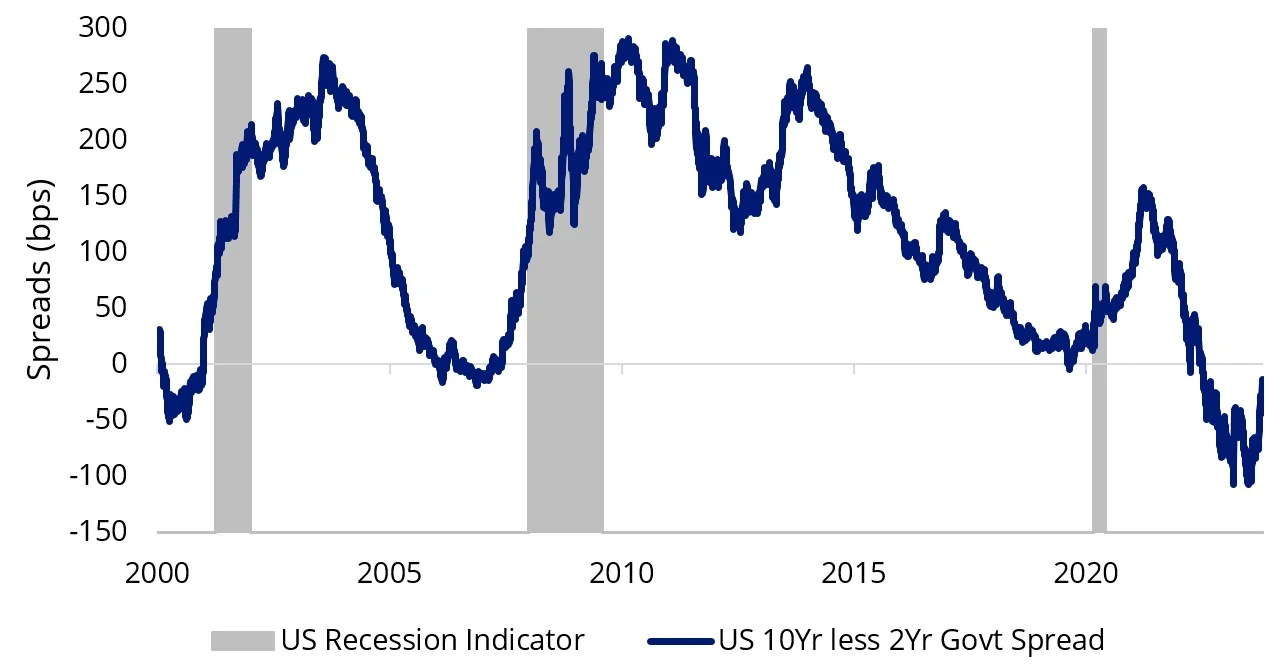
Source: Bloomberg, to 20 November 2023.
Chart 5: Contracting Credit fuelling low growth 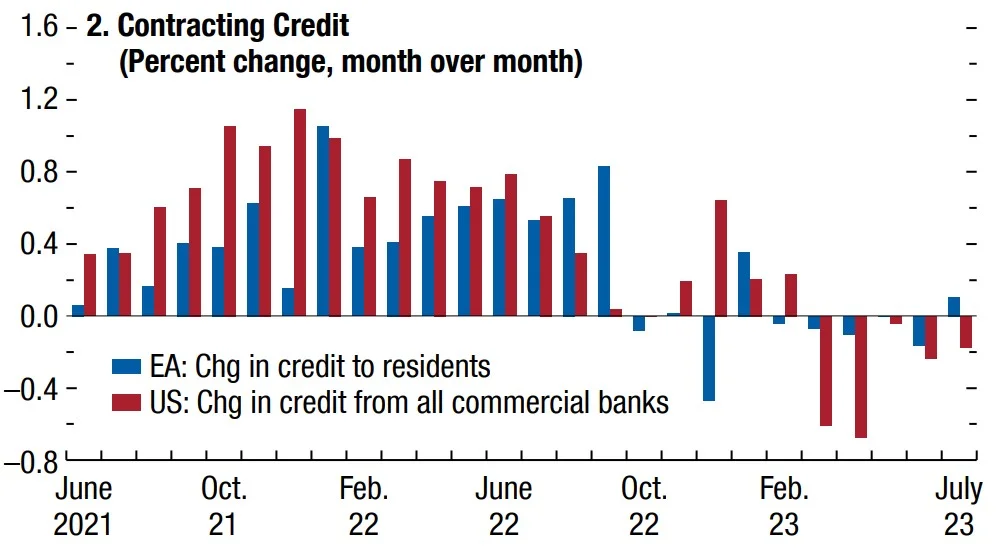
Source: IMF, World Economic Outlook
Chart 6: Higher for longer with sustained low unemployment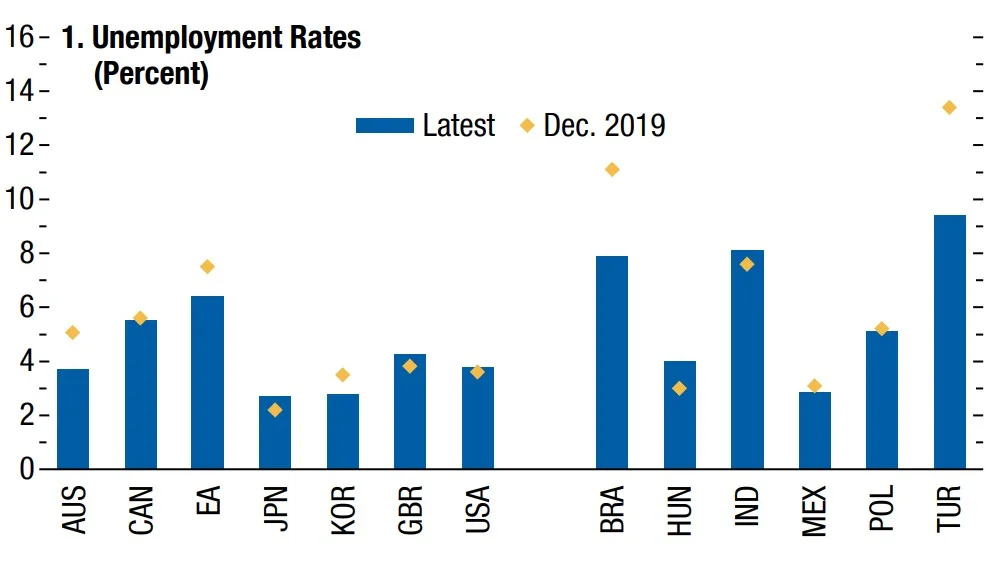
Source: IMF, World Economic Outlook
Robust economic data is impinging on Central Banks’ ability to cut rates and provide relief to households and businesses. Wide moat investors are well positioned as beneficiaries during tumultuous periods contrary to high growth companies that are hampered by rising borrowing cost and restrictions on raising capital for project and product prospects. Companies with wide moats maintain stable earnings and a greater ability to pass on cost through their well-fortified market positioning. Savvy investors can manage their equity allocation during these periods focusing on wide moat companies at a reasonable price, to manage risk.
Key risks: An investment in the funds carries risks associated with: financial markets generally, individual company management, industry sectors, ASX trading time differences, foreign currency, sector concentration, political, regulatory and tax risks, fund operations, liquidity and tracking an index. See the PDS for details.


Published: 22 November 2023
Any views expressed are opinions of the author at the time of writing and is not a recommendation to act.
VanEck Investments Limited (ACN 146 596 116 AFSL 416755) (VanEck) is the issuer and responsible entity of all VanEck exchange traded funds (Funds) trading on the ASX. This is general advice only and does not take into account any person’s financial objectives, situation or needs. The product disclosure statement (PDS) and the target market determination (TMD) for all Funds are available at vaneck.com.au. You should consider whether or not an investment in any Fund is appropriate for you. Investments in a Fund involve risks associated with financial markets. These risks vary depending on a Fund’s investment objective. Refer to the applicable PDS and TMD for more details on risks. Investment returns and capital are not guaranteed.