How Is China’s Economy Doing?
Understand where China’s economy is in its growth cycle with these two key charts.
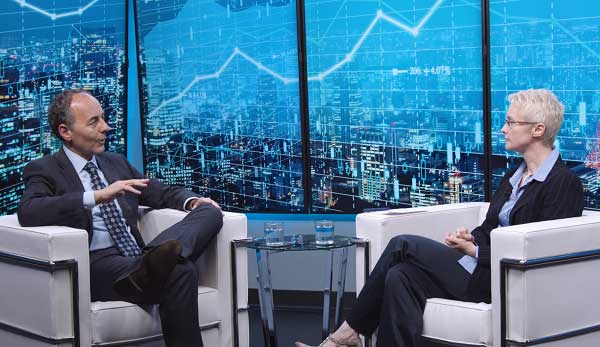
CEO Jan van Eck and Economist Natalia Gurushina discuss the state of China’s economy and highlight two key charts for understanding where it is in its growth cycle.
China has been a major contributor to global growth, and its economic activity tends to have significant repercussions for the global economy. To understand where the Chinese economy is in its growth cycle, the two charts below are perhaps the only charts one needs.
Chinese Economy Health Check: PMIs 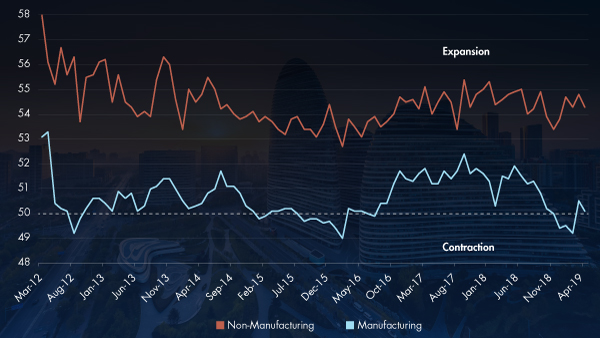
Source: Bloomberg. Data as of April 30, 2019. Past performance is no guarantee of future results. Chart is for illustrative purposes only.
Purchasing managers’ indices (PMIs) are a better indicator of the health of the Chinese economy than the gross domestic product (GDP) number, which is politicized and is a composite in any case. The manufacturing and non-manufacturing, or service, PMIs have been separated in order to understand the different sectors of the economy. These days, the manufacturing PMI is the number to watch for cyclicality. The non-manufacturing PMI shows a strong rate of expansion, which one would expect with the emergence of the “new China” economy—one that is increasingly driven by consumption. However, the manufacturing PMI shows two falls below the important 50 mark into contraction territory—showing the “recession” in late 2018 and a recovery after Q1 2019.
Understanding the Credit Cycle: Non-SOE Borrowing Costs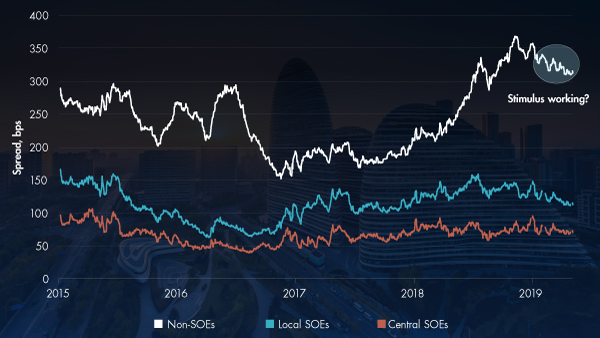
Source: UBS. Data as of May 7, 2019. Past performance is no guarantee of future results. Chart is for illustrative purposes only. Spreads are measured relative to average yield of 1, 3, 5, and 10 year bonds issued by the China Development Bank.
As with any economy, central bank policy is very important in China. In this chart, we can see that interest rates for the private sector fluctuate, whereas the interest rates paid by state-owned enterprises (SOEs) are pretty stable. Therefore, to understand the credit cycle, we point your attention to this private sector, or non-SOE, interest rate. It spiked in 2018, as a result of China’s crackdown on shadow banking, meaning tougher lending conditions for the private sector. These interest rates stopped rising in the winter of 2018 as the “drip stimulus” took effect.
IMPORTANT NOTICE: This information is issued by VanEck Investments Limited ABN 22 146 596 116 AFSL 416755 (‘VanEck) as the responsible entity and issuer of the VanEck Vectors Australian domiciled exchange traded funds (‘Funds’). Nothing in this content is a solicitation to buy or an offer to sell shares of any investment in any jurisdiction including where the offer or solicitation would be unlawful under the securities laws of such jurisdiction. This is general information only about financial products and not personal financial advice. It does not take into account any person’s individual objectives, financial situation or needs. Before making an investment decision in relation to a Fund, you should read the applicable PDS and with the assistance of a financial adviser consider if it is appropriate for your circumstances. PDSs are available at www.vaneck.com.au or by calling 1300 68 38 37. The Funds are subject to investment risk, including possible loss of capital invested. Past performance is not a reliable indicator of future performance. No member of the VanEck group of companies gives any guarantee or assurance as to the repayment of capital, the payment of income, the performance, or any particular rate of return from any Fund.


Published: 21 May 2019