The case for A-REITs
The recent market downturn and macroeconomic environment has improved the valuation profile and outlook of Australian Real Estate Investment Trusts (A-REITs). The outlook for A-REITs looks positive despite concerns about higher interest rates and inflationary pressures.
The recent market downturn and macroeconomic environment has improved the valuation profile and outlook of Australian Real Estate Investment Trusts (A-REITs), despite concerns about higher interest rates and inflationary pressures.
2022 has been a challenging year for A-REITs, in part due to the sector’s long exposed durations and ensuing price sensitivity to interest rate changes. As such, the sector has been one of the worst performers over the first half of the year, as interest rates and inflation have crept higher. Furthermore, the Australian government 10 year bond yield has more than doubled to 3.44 percent so far this year, negatively impacting A-REIT returns relative to the Australian benchmark S&P/ASX 200.
Figure 1 – Year to date Australian sector performance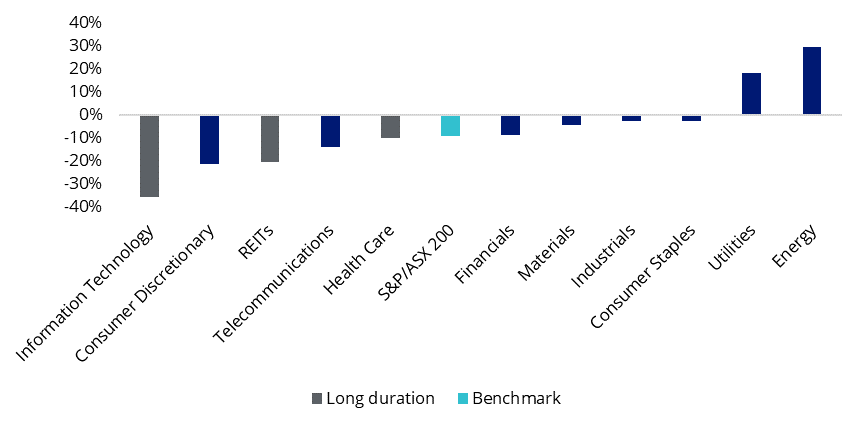
Source: Bloomberg, S&P/ASX 200 Sector indices. 1 January to 4 July 2022. Past performance is not indicative of future results.
Figure 2 – A-REITs performance relative to S&PASX 200 versus Australian government 10 year bond yield
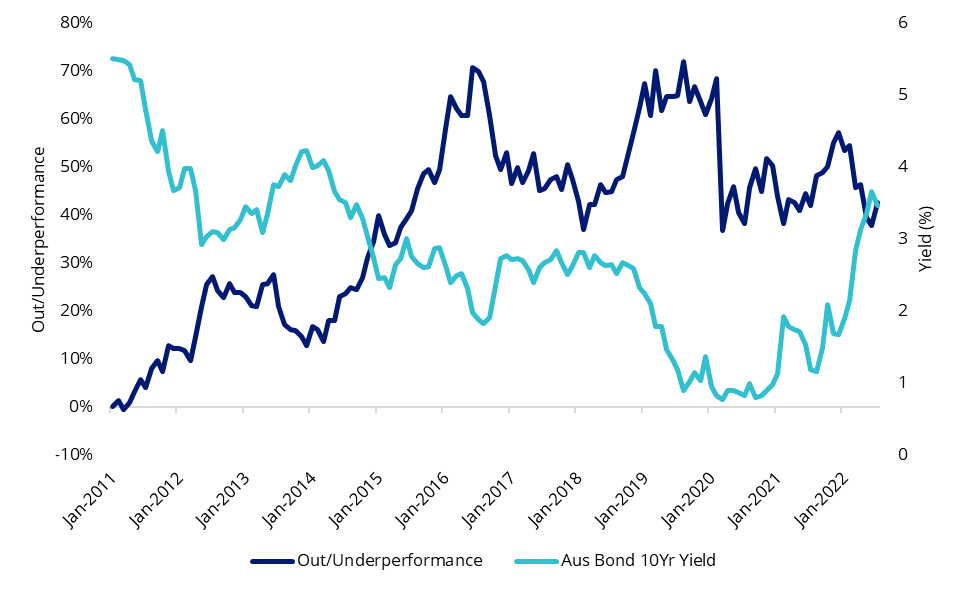
Source: Bloomberg, Out/Underperformance as MVIS Australia A-REIT cumulative performance relative to S&P/ASX 200. Past performance is not indicative of future results.
REIT growth orientated subsectors trading at higher valuation multiples such as industrials were more adversely impacted by rising yields.
Figure 3 – A-REIT subsector performance yield to date
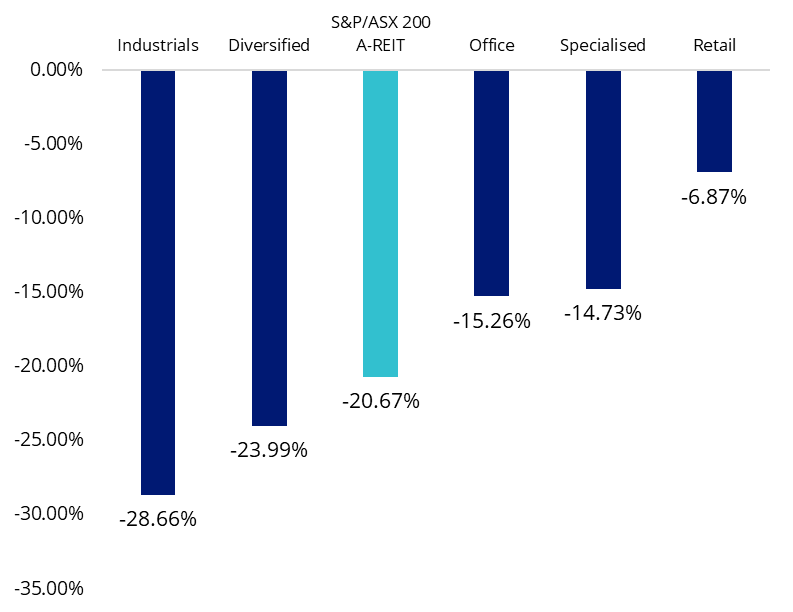
Source: Bloomberg, S&P/ASX 200 REIT subsector indices. 1 January to 4 July 2022. Past performance is not indicative of future results.
A-REIT outlook
However, the outlook for A-REITs looks more promising for three main reasons.
Firstly, long dated government bond yields could be close to reaching their peak. Broker consensus is that the expected RBA cash rate increases over the next 12 months have been priced into the Australian Government 10 year. The forecast sees the yield marginally increasing by 23 basis points by December 2022 before falling to 3.14 percent by December 2023 as aggressive monetary tightening dampens economic growth.
Figure 4 – Australian government 10 year bond yield median broker forecast
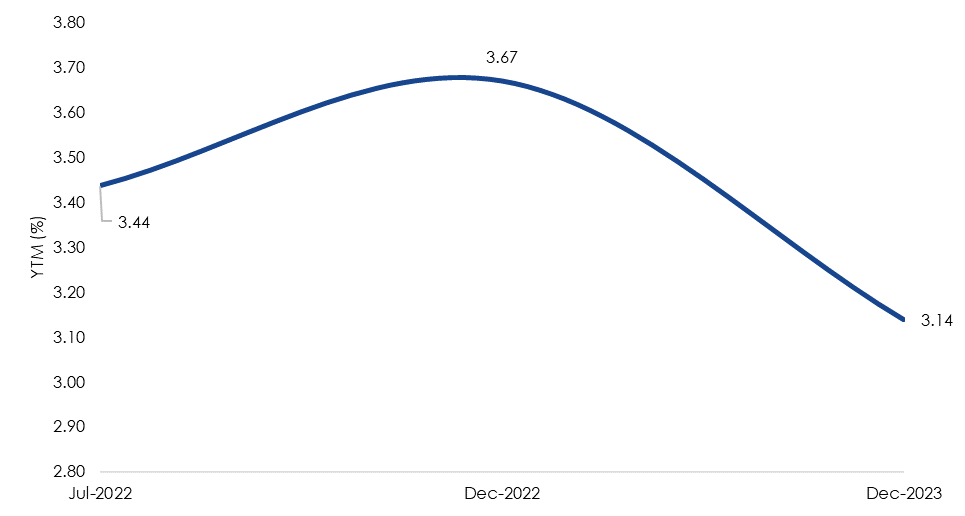
Source: Bloomberg, As at 6 June 2022.
Secondly, if the Australian economy enters an environment of sustained inflation and growth such as the period between the end of the dot-com bubble and Global Financial Crisis, REITs are well positioned. During this period Australian CPI year-on-year was 2.9 per cent on average, which is near the RBA’s current upper bound inflation target of 3 per cent. Australian 10 year government bond yields steadily increased over this time, reflecting strong economic growth.
REITs historically outperform in this type of environment, as inflation linked rental income outweighs the impact of moderate rising yields on returns. Commercial leases and contracts in office and logistics typically have inflation linked annual increases in rents written into the contract. A-REITs, as measured by the S&P/ASX 200 A-REITs index outperformed S&P/ASX 200 by 3.99 percent per annum between 1 January 2002 and 31 December 2006.
Table 1 - Australian economic indicators
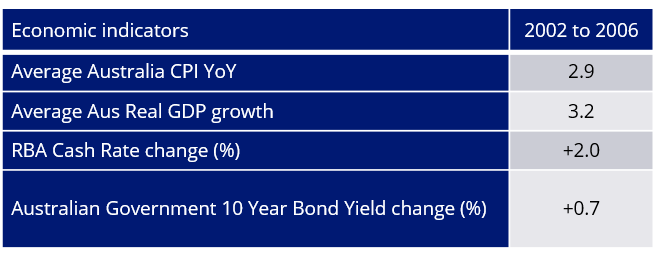
Source: Bloomberg, Australian Bureau of Statistics, Reserve Bank of Australia.
Finally, the recent drawdown in A-REIT performance potentially presents a value opportunity. Price to Adjusted Funds From Operations (AFFO multiple) and price to net tangible assets (NTA) are at a 9 year low and an historic low based on available data. These measures are market convention for valuing REITs and are preferred to metrics such as price to earnings ratios.
Figure 5: A-REIT AFFO Multiple – 2013 levels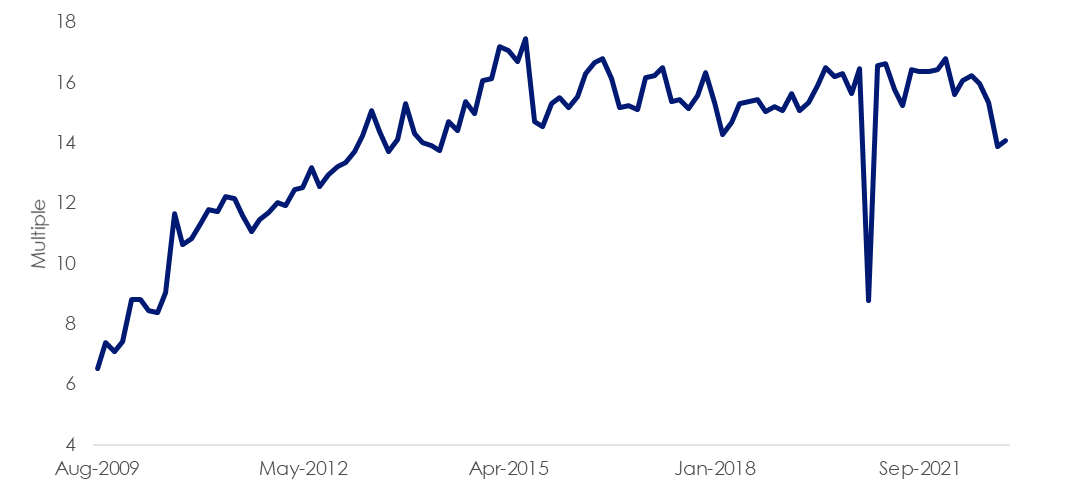
Source: Bloomberg, A-REIT as MVIS Australia A-REIT Index
Figure 6: A-REIT Price to NTA – historic low
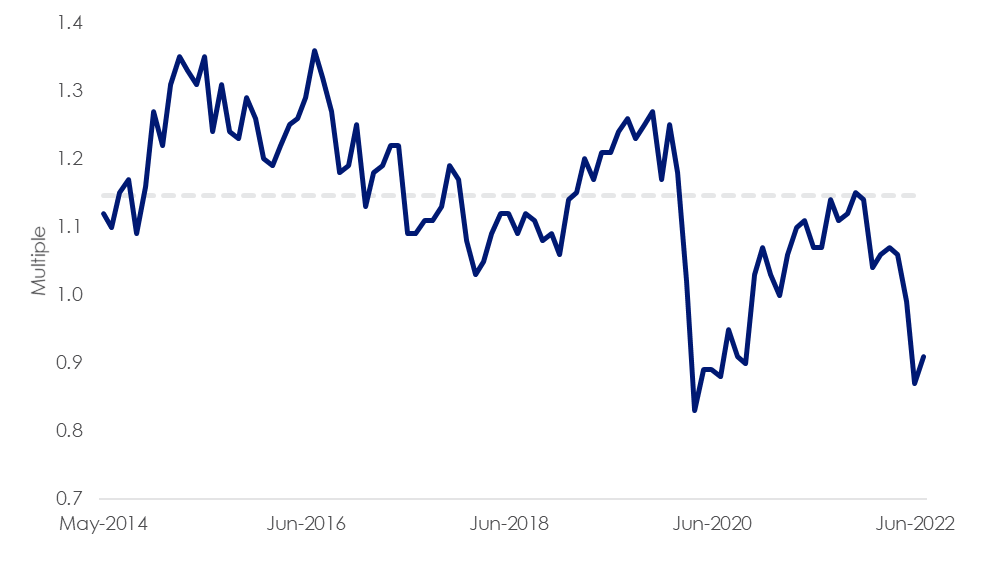
Source: Bloomberg, A-REIT as MVIS Australia A-REIT Index
Access to A-REITs
VanEck Australian Property ETF (ASX: MVA) tracks the MVIS Australia A-REIT index which caps stock weighting at 10 percent. This improves stock diversification and results in underweight industrials exposure relative to the S&P/ASX 200 A-REIT Index.
Key risks
An investment in the ETF carries risks associated with: financial markets generally, individual company management, industry sectors, stock and sector concentration, fund operations and tracking an index. See the PDS for details.

Published: 22 July 2022
Any views expressed are opinions of the author at the time of writing and is not a recommendation to act.
VanEck Investments Limited (ACN 146 596 116 AFSL 416755) (VanEck) is the issuer and responsible entity of all VanEck exchange trades funds (Funds) listed on the ASX. This is general advice only and does not take into account any person’s financial objectives, situation or needs. The product disclosure statement (PDS) and the target market determination (TMD) for all Funds are available at vaneck.com.au. You should consider whether or not an investment in any Fund is appropriate for you. Investments in a Fund involve risks associated with financial markets. These risks vary depending on a Fund’s investment objective. Refer to the applicable PDS and TMD for more details on risks. Investment returns and capital are not guaranteed.
MVIS Australia A-REITs Index (‘MVIS Index’) is the exclusive property of MV Index Solutions GmbH based in Frankfurt, Germany (‘MVIS’). MVIS is a related entity of VanEck. MVIS makes no representation regarding the advisability of investing in the Fund. MVIS has contracted with Solactive AG to maintain and calculate the MVIS Index. Solactive uses its best efforts to ensure that the MVIS Index is calculated correctly. Irrespective of its obligations towards MVIS, Solactive has no obligation to point out errors in the MVIS Index to third parties.