MVA: A premier real estate strategy
On the back of low interest rates Australian Real Estate Investment Trusts (A-REITs) have had a strong year. However, not all A-REITs funds or ETFs have performed the same. Enter the VanEck Vectors Australian Property ETF (ASX code: MVA).
MVA has offered investors enviable performance among its peers. So much so that its performance places it at the very top. It takes a beyond the usual approach, known as smart beta.
The results have to be seen to be believed.Australian investors have a number of A-REIT funds and ETFs to choose from. Based on Morningstar’s universe there are over 120 on offer (this is based on Morningstar’s Equity Australia Real Estate peer group). Performance differs and so do the fees charged.
You may have seen a chart like the one below before. This one shows the performance of the A-REIT peer group for the key performance periods being 1 year, 3 years (p.a.), 5 years (p.a.) and since the inception of VanEck Vectors Australian Property ETF (MVA).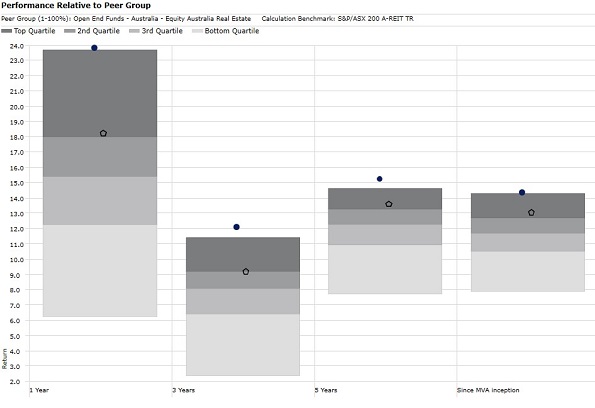
Source: Morningstar Direct, to 31 December 2018. Results are calculated daily and assume immediate reinvestment of all dividends. MVA results are net of management fees and other costs incurred in the fund but do not include brokerage costs or buy/sell spreads incurred when investing in MVA. Past performance is not a reliable indicator of future performance. Morningstar category Equity Australia - Real Estate funds invest almost exclusively in Australian listed property trusts. This may be either completely in their own right or through property syndicates. At least 75% of the portfolio is invested in listed property, with a smaller component in direct property and/or cash.
The darkest grey represents those funds and ETFs that have achieved top quartile performance. That is, as a proportion of all the offerings in the Morningstar A-REIT universe this is the top 25%. As you go down the gradient and the grey becomes lighter the range of performance goes down to the bottom quartile i.e. the bottom 25%. You therefore have four performance quartiles making up 100% of the universe.
You will notice a blue dot representing MVA and a hollow pentagon representing the market capitalisation benchmark for the S&P/ASX 200 A-REIT index. As you can see MVA has offered investors performance second to none.
MVA tracks the MVIS Australian A-REIT Index which is a smart beta strategy. It includes only the largest and most liquid ASX-listed REITs and has no foreign listings or associated withholding tax deducted from dividends. Furthermore a maximum individual holding of 10%. In contrast, the largest two constituents of the S&P/ASX 200 A-REIT Index account for 36% as at 31 October 2019 and that index also includes a foreign listing which subjects investors to transfer and withholding taxes.
As a result of the 10% capping, MVA reduces stock and sub-sector concentration that exists in the S&P/ASX 200 A-REIT Index and therefore better captures the performance of the entire spectrum of the A-REIT market. Reflecting its superior construction, the MVA Index has outperformed the S&P/ASX 200 A-REIT Index over every trailing period since its inception, a convincing outperformance.
|
|
YTD (%) |
1 Year |
3 Years |
5 Years |
Since Inception (% p.a.) |
|
MVA ETF |
25.05 |
29.52 |
15.59 |
14.16 |
14.72 |
|
S&P/ASX 200 A-REIT Index |
22.05 |
23.56 |
12.68 |
12.40 |
13.24 |
|
Outperformance |
+3.00 |
+5.96 |
+2.91 |
+1.76 |
+1.48 |
Inception date is 13 October 2014
Source: VanEck, Morningstar Direct as at 31 October 2019. Performance is in Australian dollars. Results are calculated to the last business day of the month and assume immediate reinvestment of all dividends. MVA performance includes management fees and other costs incurred in the fund but excludes broker fees and buy/sell spreads associated with investing in MVA. Past performance is not a reliable indicator of future performance of the index or MVA.
To find out more on MVA please speak to your financial adviser, stock broker or visit our dedicated MVA page here.
IMPORTANT NOTICE:
This information is issued by VanEck Investments Limited ABN 22 146 596 116 AFSL 416755 (‘VanEck’) as responsible entity and issuer of the VanEck Vectors Australian Property ETF (‘Fund’). Nothing in this content is a solicitation to buy or an offer to sell shares of any investment in any jurisdiction including where the offer or solicitation would be unlawful under the securities laws of such jurisdiction. This is only general advice about a financial product and not personal advice.. It does not take into account any person’s individual objectives, financial situation or needs. Before making an investment decision in relation to the Fund, you should read the PDS and with the assistance of a financial adviser consider if it is appropriate for your circumstances. The PDS is available at www.vaneck.com.au or by calling 1300 68 38 37. The Fund is subject to investment risk, including possible loss of capital invested. Past performance is not a reliable indicator of future performance. No member of the VanEck group of companies gives any guarantee or assurance as to the repayment of capital, the payment of income, the performance, or any particular rate of return from the Fund.
MVIS Australia A-REITs Index (‘MVIS Index’) is the exclusive property of MV Index Solutions GmbH based in Frankfurt, Germany (‘MVIS’). MVIS makes no representation regarding the advisability of investing in the Fund. MVIS has contracted with Solactive AG to maintain and calculate the MVIS Index. Solactive uses its best efforts to ensure that the MVIS Index is calculated correctly. Irrespective of its obligations towards MVIS, Solactive has no obligation to point out errors in the MVIS Index to third parties.


Published: 11 November 2019