The raison d'être for Quality
The Quality Factor is what’s called a ‘smart beta’ approach. Savvy investors have employed the Quality Factor over time and over varying market cycles, but particularly in markets such as the one we are currently experiencing. Hence the saying ‘flight to quality’, it is the Quality Factor’s ‘raison d'être’.

The French have a saying ‘raison d'être’ which translates to ‘reason for being’.
The Quality Factor is what’s called a ‘smart beta’ approach. Smart beta is a term given to ETFs that utilise an approach other than simply following market cap; ie taking a smarter approach to selecting what assets make up that ETF. Savvy investors have employed the Quality Factor over time and over varying market cycles, but particularly in markets such as the one we are currently experiencing. Hence the saying ‘flight to quality’, it is the Quality Factor’s ‘raison d'être’.
Recently the CBOE VIX, a gauge of volatility known as Wall Street’s fear index, has shot up since mid-February to its highest level since 2008. When the VIX index is high, quality companies have historically outperformed due to their financial resilience – additionally when the market has fallen, they have demonstrated lower drawdown and faster recovery.
We define Quality as investing in stocks which have:
-
- higher return on equity (ROE)
- sustainable earnings, and
- low financial leverage.
Quality has historically been a go to strategy for those astute investors due to the fact quality companies have historically demonstrated lower drawdown and a faster recovery. When volatility occurs, like the ups and downs we have seen on markets over the past few weeks, quality investing historically has served as an important defensive factor used in portfolio construction and has outperformed
Volatility returns with a bang
VIX is a real time volatility index and is a useful gauge of investor sentiment and expected market volatility. The VIX Index has skyrocketed over the past two weeks to 82.69, its highest ever level. This has coincided with an almost 30% plunge in global share markets.
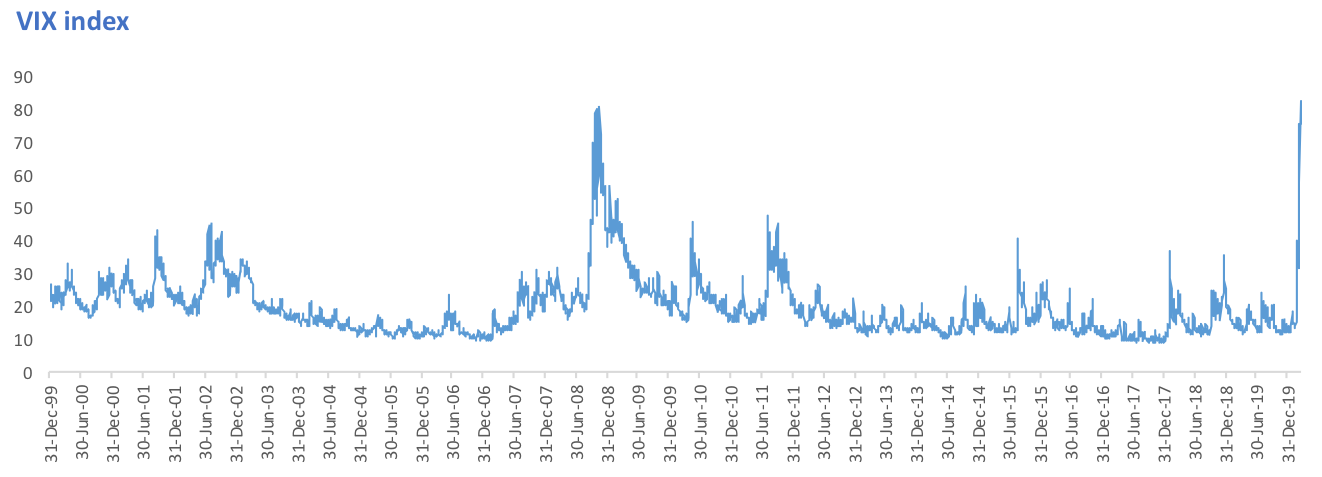
Source: Bloomberg, CBRE, as at 18 March 2020
Quality withstands volatility
History has persistently shown that in times of volatility, quality companies have outperformed. This year has been no different. In the chart below, when the orange line is rising, quality is outperforming. In the most recent periods of extreme volatility – 2001’s dot com bust, 2007/08, the Euro debt crises, 2015 and 2018 - quality has outperformed the market benchmark. You can also see it has outperformed sharply during the start of this period of volatility.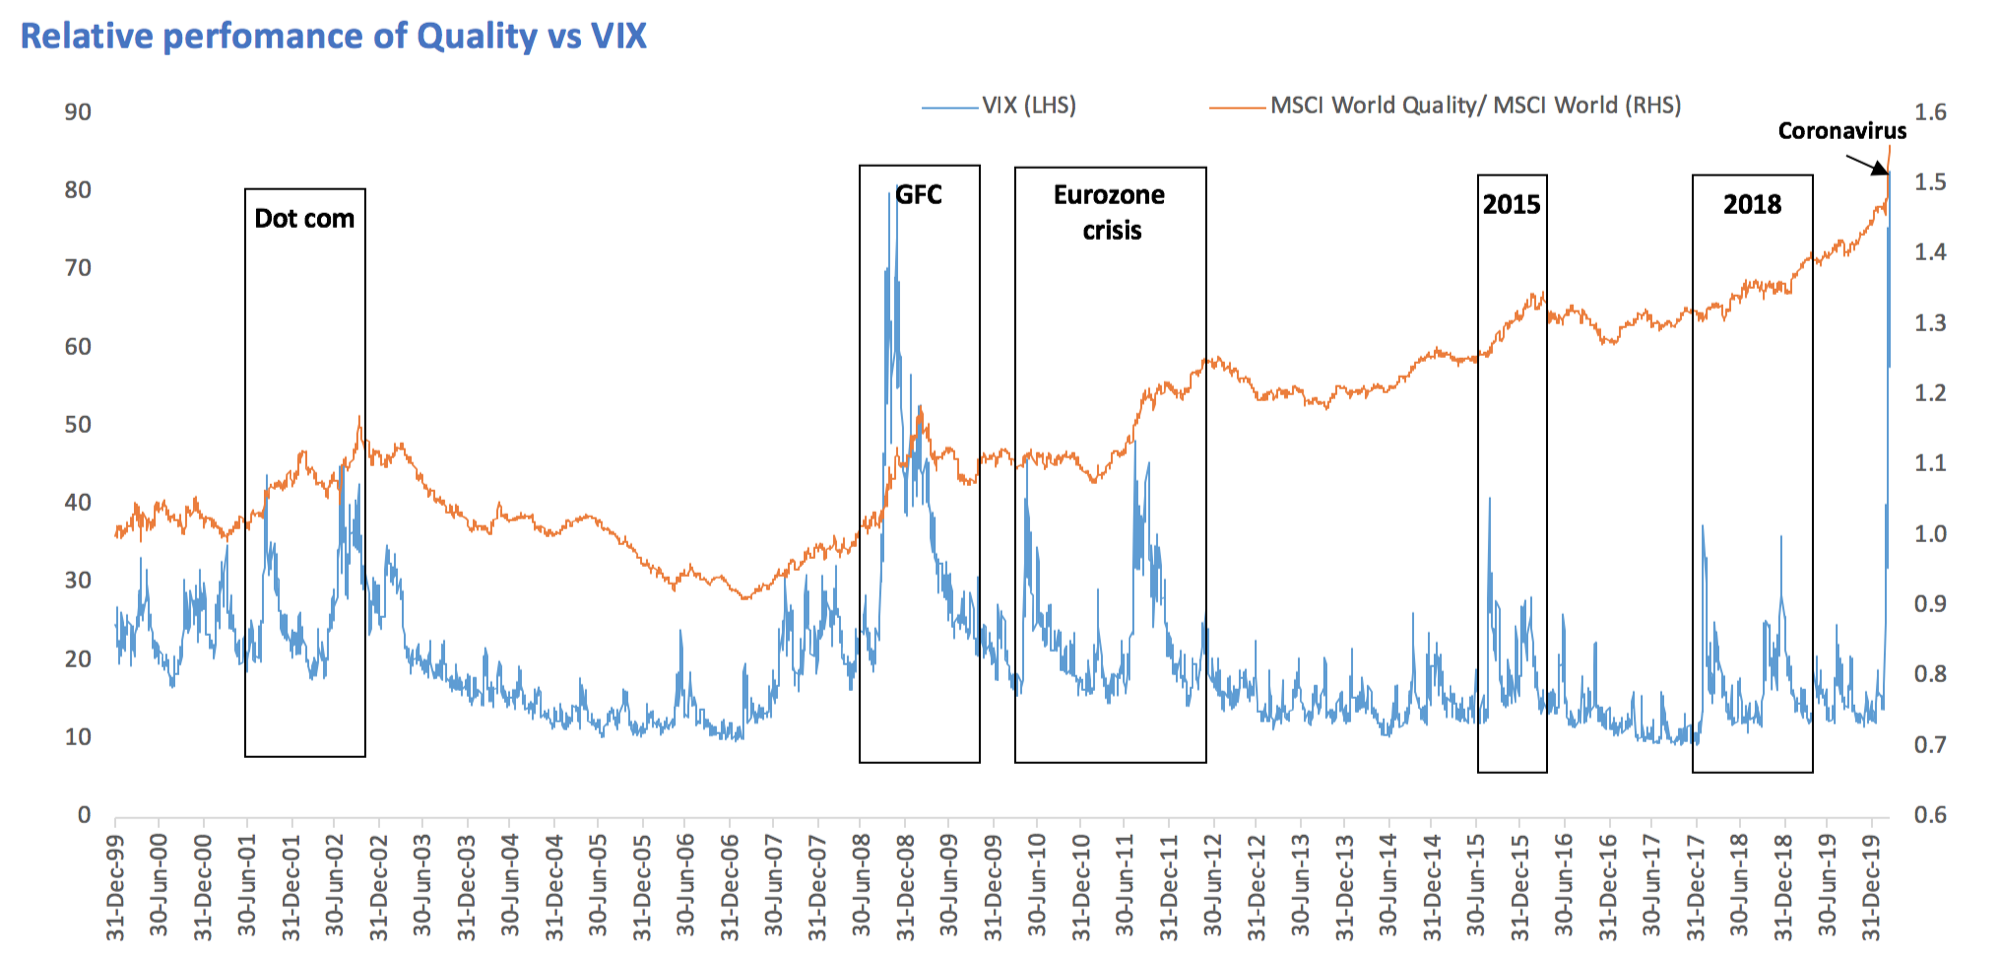
Source: MSCI Data/Calculations, Bloomberg, CBRE, December 1999 to 18 March 2020. The chart shows performance of MSCI World Quality relative to MSCI World compared to VIX Index. Results include the reinvestment of all dividends, but exclude fees and other costs associated with an investment in QUAL. You cannot invest in an index. Past performance is not a reliable indicator of future performance of the index or QUAL.
Minimising drawdowns
A measure called ‘drawdown’ demonstrates both the depth of a fall from an historical peak and the pace of the recovery to a new peak. During each market downturn since 2000, the Quality Index has sold off less than the benchmark index, the MSCI World ex Australia Index. In the months following the drawdowns prior to this most recent one, the Quality Index recovered more quickly as the table below highlights.
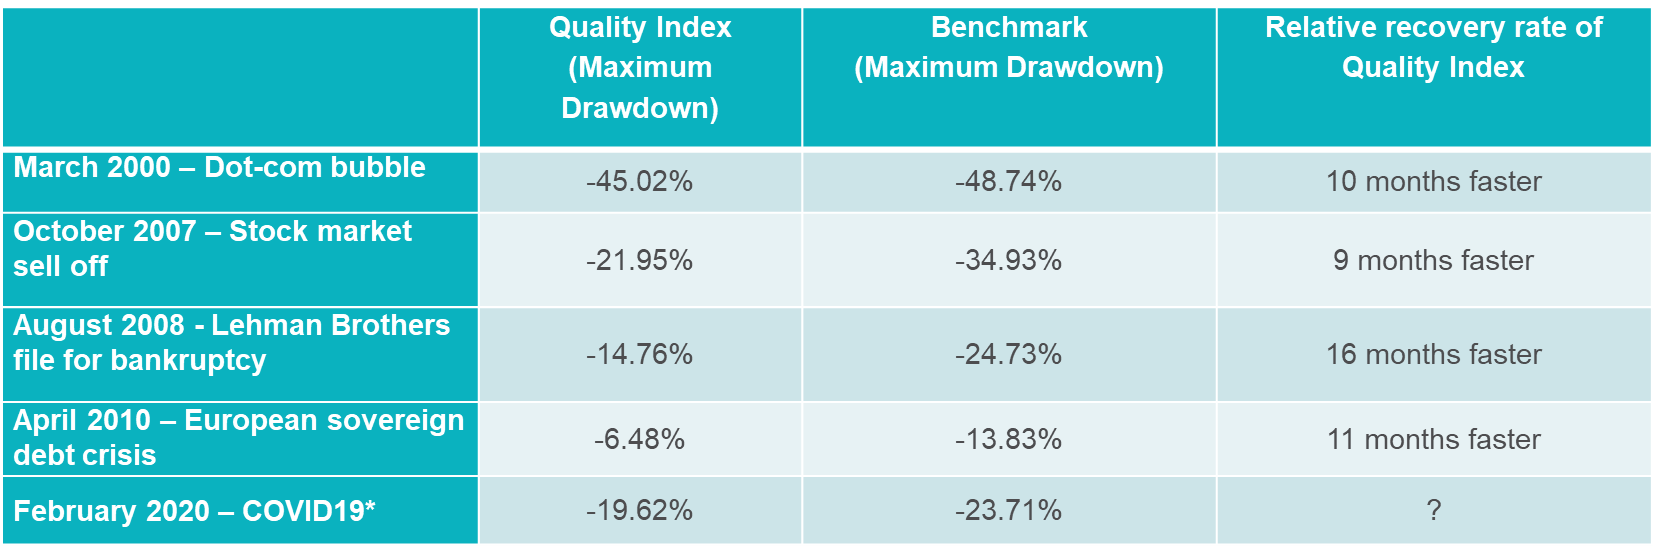
* Drawdown to 18 March 2020. Source: MSCI, VanEck, Morningstar Direct. Comparison of drawdown between the MSCI World ex Australia Quality Index (‘Quality Index’) versus the MSCI World ex Australia Index (‘Benchmark’). Maximum drawdown is the peak to trough decline from the start of the month specified to the recovery date, expressed as a percentage. The rate of recovery is the number of periods taken to recover from the trough to peak incline. The calculations for the above include the reinvestment of all dividends but do not include fees and other costs associated with an investment in QUAL. You cannot invest in an index. Past performance is not a reliable indicator of future performance of the index or QUAL.
This resilience is one of the reasons quality companies have outperformed over the long term.
Accessing the Quality Factor
Quality companies have demonstrated outperformance during periods of economic slowdown, such as the period we are now in, and over the long term.
With one trade, VanEck Vectors MSCI World ex Australia Quality ETF (ASX: QUAL) provides access to 20 developed countries and is overweight sectors such as healthcare and information technology which are underrepresented in Australia. A proven strategy that has returned 15.21% p.a. since inception to 11 March 2020, QUAL has outperformed the MSCI World ex Australia Index by 3.78% p.a. Alternatively, VanEck Vectors MSCI World ex Australia Quality (Hedged) ETF (ASX: QHAL) is an Australian dollar hedged version of QUAL so you can manage your desired currency exposure.
Since its inception on 29 October 2014, QUAL has returned 15.21% p.a., outstripping the standard industry benchmark, the MSCI World Ex Australia Index, by 3.78% p.a. QUAL has convincingly outperformed over the past few weeks during the share market turmoil triggered by the coronavirus global spread.
QUAL and QHAL are indexed to a MSCI index. The ETFs are not sponsored, endorsed, or promoted by MSCI, and MSCI bears no liability with respect to QUAL or QHAL or the MSCI Index. The PDSs contain a more detailed description of the limited relationship MSCI has with VanEck and the ETFs.
The Lonsec Rating (assigned May 2019) presented in this document is published by Lonsec Research Pty Ltd ABN 11 151 658 561 AFSL 421 445. The Rating is limited to "General Advice" (as defined in the Corporations Act 2001 (Cth)) and based solely on consideration of the investment merits of the financial product(s). Past performance information is for illustrative purposes only and is not indicative of future performance. It is not a recommendation to purchase, sell or hold VanEck products, and you should seek independent financial advice before investing in this product. The Rating is subject to change without notice and Lonsec assumes no obligation to update the relevant document(s) following publication. Lonsec receives a fee from the Fund Manager for researching the product using comprehensive and objective criteria. For further information regarding Lonsec's Ratings methodology, please refer to our website at: http://www.beyond.lonsec.com.au/intelligence/lonsec-ratings
The Zenith Investment Partners ("Zenith") Australian Financial Services License No. 226872 rating (assigned October 2019) referred to in this document is limited to "General Advice" (as defined by the Corporations Act 2001) for wholesale clients only. This advice has been prepared without taking into account the objectives, financial situation or needs of any individual. It is not a specific recommendation to purchase, sell or hold the relevant product. Investors should seek independent financial advice before making an investment decision and should consider the appropriateness of this advice in light of their own objectives, financial situation and needs. Investors should obtain a copy of, and consider the PDS or offer document before making any decision and refer to the full Zenith Product Assessment available on the Zenith website. Zenith usually charges the product issuer, fund manager or a related party to conduct Product Assessments. Full details regarding Zenith's methodology, ratings definitions and regulatory compliance are available on our Product Assessment's and at http://www.zenithpartners.com.au/RegulatoryGuidelines


Published: 23 March 2020